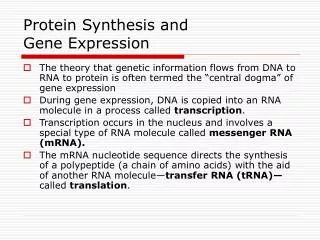
Gene Expression Analysis and Protein Pathways: Insights from CuraGen's Research
This document presents an extensive overview of gene expression analysis and protein pathways based on the research conducted at CuraGen. It covers methodologies for clustering gene expression data, the development of therapeutic proteins and antibodies, and approaches to mapping biological pathways, including mRNA coregulation and protein-protein interactions. The document emphasizes the importance of statistical significance, power estimates, and innovative algorithms in understanding disease risks and drug targets, highlighting CuraGen's contributions to high-throughput biology and bioinformatics.


Gene Expression Analysis and Protein Pathways: Insights from CuraGen's Research
E N D
Presentation Transcript
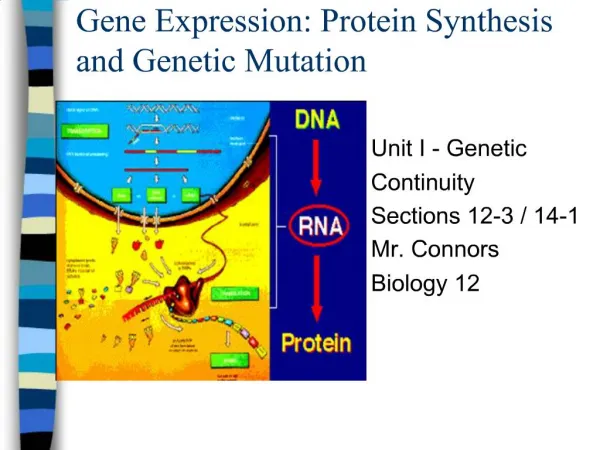
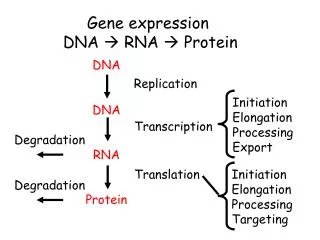
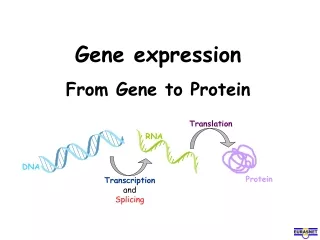
Gene expression and protein pathways Joel S Bader CuraGen jsbader@curagen.com IPAM 2000 Nov 8 CuraGen
CuraGen Background • Product pipeline • Therapeutic proteins • Therapeutic antibodies • Drug targets • Technology • High-throughput biology labs • Bioinformatics/information-intensive CuraGen
Outline • Clustering gene expression data • Interior-node test • Statistical significance • Power • Mapping biological pathways • Metabolic pathways • mRNA coregulation • Protein-protein interactions • Overlaying • Genetic studies • Disease risk • SNPs and association CuraGen
Clustering • Standard method (now) for analyzing gene expression data • Unsupervised algorithms • Run to completion • Clustering eventually driven by noise, not biology • Supervised algorithms • Inconsistent, irreproducible • Not amenable to high-throughput • Goal: automated, unsupervised, with meaningful p-value for clusters produced • Collaboration with Rebecca W Doerge and Brian Munneke, Dept of Statistics, Purdue CuraGen
Hierarchical, distance-based algorithm • Initialize: each gene in a single cluster • Repeat • Join clusters with shortest distance • Re-calculate effective distances • Until 1 cluster remains Neighbor-joining: distance is corrected to be distance between ancestors Studier & Keppler, Mol Biol Evol 5: 729 (1988) Unweighted pair group method arithmetic mean: distance is mean of all pair-wise distances NJ distance UPGMA distance CuraGen
(Typical) results Data taken from X. Wen, …, R Somogyi, PNAS 95: 334 (1998) Large-scale temporal gene expression mapping of central nervous system development 9 time points, embryonic to adult 112 genes Clustering Multidimensional scaling, principal component/factor analysis CuraGen
Raw data and clusters • Set baseline • Normalize columns (time-points) • Log-transform • Subtract row averages (genes) • Neighbor-joining using correlation distance CuraGen
Interior-branch test Parametric based on branch length and variance estimator Branch length error is not normally distributed Small sample size Global test, draws information from entire tree, doesn’t test a node directly Not consistent with neighbor-joining algorithm Bootstrap test Resample data matrix by choosing columns at random with replacement Requires underlying data Computationally intensive Also not consistent with neighbor-joining algorithm Significance tests Our approach: interior-node test using neighbor-joining statistic and permutation/randomization CuraGen
Alternative and null hypotheses Equivalent to interior-branch test for unrooted tree IJKL Test statistic: total length of tree under node X CuraGen
Algorithm Replace nodes A and B with star-trees of terminal taxa Total length = star-tree of A + star-tree of B + branch length AB LA = (NA–1)–1 TAA LB = (NA–1)–1 TBB LAB = (NANB)–1TAB – NA–1LA – NB–1LB Calculate p-value from > 1000 re-assignments of terminal taxa with fixed NA, NB CuraGen
Results, p-value = 0.001 Too liberal Too conservative Too conservative CuraGen
Power estimate Model: Pairwise distance between terminal taxa m and n is dmn = d0 + Imnd + mn I = 0 or 1 if taxa are in same/different cluster H = fraction of pairs across clusters Var() = 2 Expectations: E(LStar) = Nd0/2 + NHd/2 E(LAlt) = Nd0/2 + d Var(LAlt) = [ 1 – (N–2)/2NANB ]22 Power = [(NHd/2) – 2–1/2z] CuraGen
Conclusion • Interior-node test based on resampling • P-value 0.01 to 0.001 gives good results • For just-resolved clusters (distance between ~ standard deviation within), need 8-10 terminal taxa per cluster for significance • Other work • Different clustering algorithms, better power • 2D extensions • PCA, regression, prediction • Applications • Disease-related pathways, target identification/validation • Pharmacogenomics: predictive toxicity, efficacy markers (immediately commercializable) • Exploration of coregulation pathways CuraGen
Mapping biological pathways • Metabolic pathways • mRNA coregulation Red: UpBlue: Down CuraGen
Mapping biological pathways • Metabolic pathways • mRNA coregulation • Protein-protein interactions • Yeast two-hybrid system • Genome-scale survey of yeast • Overview of PathCalling • Comparison of pathways from protein-protein interactions and mRNA correlation • PathCalling bioinformatics: Jim Knight, CuraGen www.curagen.com Nature 403: 623 (2000) Collaboration with Stan Fields CuraGen
PathCalling process Candidate genes Whole-genome ORFS Whole-genome library Bait design Matings Interactions (pairwise links) CuraGen
Results Pairwise interactions built into pathways Infer human pathways by homology CuraGen
Prob(corln) Correlation in expression Comparing Interaction and Expression • Use correlated expression to infer a protein-protein link • What is the overlap between expression links and interaction links? • Yeast expression data from Pat Brown group • Yeast interaction data from CuraGen/Fields Interacting proteins (black line) are slightly more likely to have positive correlation than random ORFs (grey line) Difference is small CuraGen
In progress • Combined visualization of expression/interaction data • Drosophila whole-genome interaction scan (with Rubin group) CuraGen
SNP-based association studies • Cross-validation • Candidate genes from expression • Independent statistical/biological validation • QTLs from genetics • Genetic determinants of complex disease • Risk factors, low penetrance, no clear Mendelian inheritance • Traditional linkage analysis has low power • Association: direct effects of causative mutations • Requirements for association tests • Causative/dense marker set (SNPs) • Large population (1000s to 10,000s) • Cheap genotyping CuraGen
Causative SNPs • Candidates: • Non-cons aa change • Drug target • Disease pathway • Drug metabolism CuraGen
Large populations Cost: 2000 genotypes x 1000 candidates 2 M genotypes target value ~ $1M CuraGen
Allele dose AA Aa aa Cheap genotyping: pooling Selection thresholds (affected/unaffected) Phenotypic value Upper pool Enriched in A Lower pool Depleted in A Measure allele frequency difference between pools CuraGen
Choosing a threshold • Optimization: transform a quantitative phenotype into a qualitative phenotype • How does the optimal threshold depend on • Desired false-positive rate • Population size • Allele frequency • Inheritance mode (dominant, additive, recessive) • What happens when all you have is a qualitative, disease/normal phenotype? • Collaboration with Aruna Bansal and Pak Sham, Gemini Genomics CuraGen
aa Aa,AA aa Aa AA aa,Aa AA Variance components model Biallelic marker A/a Complex trait Dominant: Additive: Recessive: Other QTLs, environmental factors, central limit theorem Standardized total variance = 1 = V(A) + V(D) + V(R) Usually V(R) >> V(A) >> V(D) Phenotypic shift from single QTL Variance = V(A) + V(D) Standard model for QTL mapping, Falconer & McKay CuraGen
Allele dose AA Aa aa Analytic results Selection thresholds Measure allele freq diff Dp y = exp[-F-1(r)2/2]/(2p)1/2 fractionr fractionr Phenotypic value E(Dp) = 21/2y0A/R Var(Dp) = 02/rN N= [z – z1–]2 [VR/VA] /2y2 Geometric factor, 1 for indiv genotyping 1.24 for pooled DNA CuraGen
Relative efficiency Case-control pooling for typical 10% disease incidence is 5X less efficient Population required relative to individual genotyping for same type I and type II error rate Best efficiency at 27% Only 25% less efficient than individual genotyping CuraGen
Population size Genome scan: Type I error 5x10⁻⁸ Type II error 0.2 Lines: exact calculation Dots: analytic formulas V(A) ~ 1 / # genes involved Additive variance is equivalent to a multiplicative haplotype-relative-risk model. Relative risk is calculated at an allele freq of 10% Monogenic trait: V(A) ~ 0.1 or more CuraGen
Applications • Disease-risk markers • 11 major areas • 100s of phenotypes • 1000s of sib-pairs for initial screen • Independent disease-specific follow-up populations • Adverse drug effect markers • Efficacy markers, personalized medicine CuraGen
Summary • Using genomics to improve drug discovery and development • Exploratory analysis of gene expression • Significance thresholds for clustering • Identification of disease/drug-response pathways • Expression-based markers for drug toxicity, efficacy (pharmacogenomics) • Protein pathways • High-throughput PathCalling Y2H system • Overlaying with expression, metabolic pathways • Genetic variation • Large-scale association studies: SNPs, pooled DNA • New targets • Disease-risk, drug-response markers (pharmacogenetics) CuraGen
Acknowledgements • Gene expression • CuraGen’s GeneCalling bioinformatics group: Darius Dziuda, Shu-Xia Li, Ying Li, Yi Liu, John Tobias, Yi Zhao • Prof Rebecca W Doerge and Brian Munneke, Purdue • Protein pathways • Jim Knight (CuraGen) • Large-scale association studies • Pak Sham (Univ of London) and Aruna Bansal (Gemini Genomics) • CuraGen’s genomics facility • We’re hiring jsbader@curagen.com (203)974-6236 CuraGen