
Simultaneous Surface Emissivity and Temperature Determination from NOAA-10/HIRS Observations
E N D
Presentation Transcript
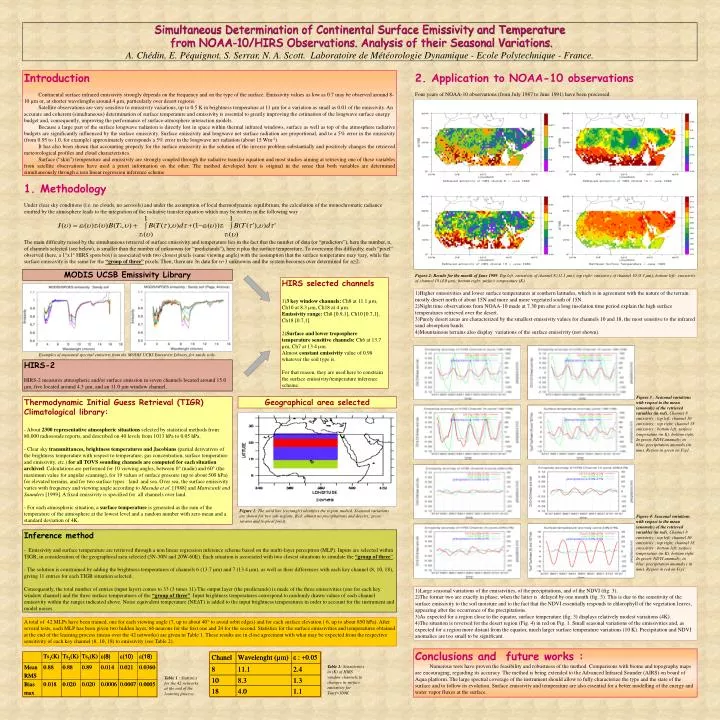
Simultaneous Determination of Continental Surface Emissivity and Temperature from NOAA-10/HIRS Observations. Analysis of their Seasonal Variations.A. Chédin, E. Péquignot, S. Serrar, N. A. Scott. Laboratoire de Météorologie Dynamique - Ecole Polytechnique - France. Introduction Continental surface infrared emissivity strongly depends on the frequency and on the type of the surface. Emissivity values as low as 0.7 may be observed around 8-10 µm or, at shorter wavelengths around 4 µm, particularly over desert regions. Satellite observations are very sensitive to emissivity variations, up to 0.5 K in brightness temperature at 11 µm for a variation as small as 0.01 of the emissivity. An accurate and coherent (simultaneous) determination of surface temperature and emissivity is essential to greatly improving the estimation of the longwave surface energy budget and, consequently, improving the performance of surface-atmosphere interaction models. Because a large part of the surface longwave radiation is directly lost in space within thermal infrared windows, surface as well as top of the atmosphere radiative budgets are significantly influenced by the surface emissivity. Surface emissivity and longwave net surface radiation are proportional, and to a 5% error in the emissivity (from 0.95 to 1.0, for example) approximately corresponds a 5% error in the longwave net radiation (about 15 Wm-2). It has also been shown that accounting properly for the surface emissivity in the solution of the inverse problem substantially and positively changes the retrieved meteorological profiles and cloud characteristics. Surface (“skin”) temperature and emissivity are strongly coupled through the radiative transfer equation and most studies aiming at retrieving one of these variables from satellite observations have used a priori information on the other. The method developed here is original in the sense that both variables are determined simultaneously through a non linear regression inference scheme. 2. Application to NOAA-10 observations Four years of NOAA-10 observations (from July 1987 to June 1991) have been processed. 1. Methodology Under clear sky conditions (i.e. no clouds, no aerosols) and under the assumption of local thermodynamic equilibrium, the calculation of the monochromatic radiance emitted by the atmosphere leads to the integration of the radiative transfer equation which may be written in the following way : The main difficulty raised by the simultaneous retrieval of surface emissivity and temperature lies in the fact that the number of data (or “predictors”), here the number, n, of channels selected (see below), is smaller than the number of unknowns (or “predictands”), here n plus the surface temperature. To overcome this difficulty, each “pixel” observed (here, a 1°x1° HIRS spots box) is associated with two closest pixels (same viewing angle) with the assumption that the surface temperature may vary, while the surface emissivity is the same for the “group of three” pixels. Then, there are 3n data for n+3 unknowns and the system becomes over determined for n≥2. MODIS UCSB Emissivity Library Figure 2: Results for the month of June 1989. Top left: emissivity of channel 8 (11.1 µm); top right: emissivity of channel 10 (8.3 µm); bottom left: emissivity of channel 18 (4.0 µm); bottom right: surface temperature (K). HIRS selected channels 1)3 keywindow channels: Ch8 at 11.1 µm, Ch10 at 8.3 µm, Ch18 at 4 µm. Emissivity range: Ch8 [0.9,1], Ch10 [0.7,1], Ch18 [0.7,1]. 2)Surface and lower troposphere temperature sensitive channels: Ch6 at 13.7 µm, Ch7 at 13.4 µm. Almost constant emissivity value of 0.98 whatever the soil type is. For that reason, they are used here to constrain the surface emissivity/temperature inference scheme. 1)Higher emissivities and lower surface temperatures at southern latitudes, which is in agreement with the nature of the terrain: mostly desert north of about 15N and more and more vegetated south of 15N. 2)Night time observations from NOAA-10 made at 7.30 pm after a long insolation time period explain the high surface temperatures retrieved over the desert. 3)Purely desert areas are characterized by the smallest emissivity values for channels 10 and 18, the most sensitive to the infrared sand absorption bands. 4)Mountainous terrains also display variations of the surface emissivity (not shown). Examples of measured spectral emissivty from the MODIS UCBS Emissivity Library, for sandy soils. HIRS-2 HIRS-2 measures atmospheric and/or surface emission in seven channels located around 15.0 mm, five located around 4.3 mm, and an 11.0 mm window channel. Figure 3 : Seasonal variations with respect to the mean (anomaly) of the retrieved variables (in red). Channel 8 emissivity : top left; channel 10 emissivity : top right; channel 18 emissivity : bottom left; surface temperature (in K): bottom right. In green: NDVI anomaly; in blue: precipitation anomaly (in mm). Region in green on Fig1. • Thermodynamic Initial Guess Retrieval (TIGR) Climatological library: • About 2300 representative atmospheric situations selected by statistical methods from 80,000 radiosonde reports, and described on 40 levels from 1013 hPa to 0.05 hPa. • Clear sky transmittances, brightness temperatures and Jacobians (partial derivatives of the brightness temperature with respect to temperature, gas concentration, surface temperature and emissivity, etc.) for all TOVS sounding channels are computedfor each situation archived. Calculations are performed for 10 viewing angles, between 0° (nadir) and 60° (the maximum value for angular scanning), for 19 values of surface pressure (up to about 500 hPa) for elevated terrains, and for two surface types : land and sea. Over sea, the surface emissivity varies with frequency and viewing angle according to Masuda et al. [1988] and Matricardi and Saunders [1999]. A fixed emissivity is specified for all channels over land. • For each atmospheric situation, a surface temperature is generated as the sum of the temperature of the atmosphere at the lowest level and a random number with zero mean and a standard deviation of 4K. Geographical area selected Figure 1: The solid line (rectangle) identifies the region studied. Seasonal variations are shown for two sub-regions. Red: almost no precipitations and deserts; green: savana and tropical forest. Figure 4: Seasonal variations with respect to the mean (anomaly) of the retrieved variables (in red). Channel 8 emissivity : top left; channel 10 emissivity : top right; channel 18 emissivity : bottom left; surface temperature (in K): bottom right. In green: NDVI anomaly; in blue: precipitation anomaly ( in mm). Region in red on Fig1. • Inference method • Emissivity and surface temperature are retrieved through a non linear regression inference scheme based on the multi-layer perceptron (MLP). Inputs are selected within TIGR, in consideration of the geographical area selected (5N-30N and 20W-60E). Each situation is associated with two closest situations to simulate the “group of three”. • The solution is constrained by adding the brightness temperatures of channels 6 (13.7 µm) and 7 (13.4 µm), as well as their differences with each key channel (8, 10, 18), giving 11 entries for each TIGR situation selected. • Consequently, the total number of entries (input layer) comes to 33 (3 times 11).The output layer (the predictands) is made of the three emissivities (one for each key window channel) and the three surface temperatures of the “group of three”. Input brightness temperatures correspond to randomly drawn values of each channel emissivity within the ranges indicated above. Noise equivalent temperature (NEDT) is added to the input brightness temperatures in order to account for the instrument and model noises. 1)Large seasonal variations of the emissivities, of the precipitations, and of the NDVI (fig. 3). 2)The former two are exactly in phase, when the latter isdelayed by one month (fig. 3). This is due to the sensitivity of the surface emissivity to the soil moisture and to the fact that the NDVI essentially responds to chlorophyll of the vegetation leaves, appearing after the occurrence of the precipitations. 3)As expected for a region close to the equator, surface temperature (fig. 3) displays relatively modest variations (4K). 4)The situation is reversed for the desert region (Fig. 4) in red on Fig. 1. Small seasonal variations of the emissivities and, as expected for a region more distant from the equator, much larger surface temperature variations (10 K). Precipitation and NDVI anomalies are too small to be significant. A total of 42 MLPs have been trained, one for each viewing angle (7, up to about 40° to avoid orbit edges) and for each surface elevation ( 6, up to about 850 hPa). After several tests, each MLP has been given two hidden layer, 66 neurons for the first one and 24 for the second. Statistics for the surface emissivities and temperatures obtained at the end of the learning process (mean over the 42 networks) are given in Table 1. These results are in close agreement with what may be expected from the respective sensitivity of each key channel (8, 10, 18) to emissivity (see Table 2). Conclusions and future works : Numerous tests have proven the feasibility and robustness of the method. Comparisons with biome and topography maps are encouraging, regarding its accuracy. The method is being extended to the Advanced Infrared Sounder (AIRS) on board of Aqua platform. The large spectral coverage of the instrument should allow to fully characterize the type and the state of the surface and to follow its evolution. Surface emissivity and temperature are also essential for a better modelling of the energy and water vapor fluxes at the surface. Table 2: Sensitivities in (K) of HIRS window channels to changes in surface emissivity for Tsurf=300K. Table 1 : Statistics for the 42 networks at the end of the learning process.


