One-Compartment Open Model in Pharmacokinetics
820 likes | 1.45k Vues
Learn about the one-compartment open model, drug distribution, elimination, and pharmacokinetic properties. Understand key parameters like Vd and K, and the significance of drug equilibration in the body. Explore mathematical estimation methods for Vd.

One-Compartment Open Model in Pharmacokinetics
E N D
Presentation Transcript
One Compartment Open ModelIV bolus Dr Mohammad Issa
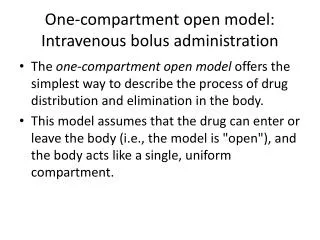
One compartment open model • The one-compartment open model offers the simplest way to describe the process of drug distribution and elimination in the body. • This model assumes that the drug can enter or leave the body (ie, the model is "open"), and the body acts like a single, uniform compartment. • The simplest route of drug administration from a modeling perspective is a rapid intravenous injection (IV bolus).
One compartment open model • The simplest kinetic model that describes drug disposition in the body is to consider that the drug is injected all at once into a box, or compartment, and that the drug distributes instantaneously and homogenously throughout the compartment. • Drug elimination also occurs from the compartment immediately after injection.
Properties of a Pharmacokinetic Compartment • Kinetic homogeneity. A compartment contains tissues that can be grouped according to similar kinetic properties to the drug allowing for rapid distribution between tissues • Although tissues within a compartment are kinetically homogeneous, drug concentrations within a compartment may have different concentrations of drug depending on the partitioning and binding properties of the drug. • Within each compartment, distribution is immediate and rapidly reversible. • Compartments are interconnected by first-order rate constants. Input rate constants may be zero order
One compartment: Drug amount in the Body (X) IV bolus administration (dose = X0) Elimination process Elimination rate constant (K) Based on the assumption of first order elimination process:
One compartment open model C= concentration D= dose Vd: Volume of distribution K: elimination rate constant t: time Drug Conc (C) Time
How to distinguish one comp? Plotting log(C) vs. time yields a straight line log (C) Time
Fundamental parameters in one compartment • Apparent Volume of Distribution (Vd) • Elimination rate constant (K) • Elimination half life (t1/2) • Clearance (Cl)
Apparent Volume of Distribution (Vd) 100 mg C= 10 mg/L C= 1 mg/L Vd= 10 L Vd= 100 L
Apparent Volume of Distribution (Vd) • In general, drug equilibrates rapidly in the body. When plasma or any other biologic compartment is sampled and analyzed for drug content, the results are usually reported in units of concentration instead of amount • Each individual tissue in the body may contain a different concentration of drug due to differences in drug affinity for that tissue. Therefore, the amount of drug in a given location can be related to its concentration by a proportionality constant that reflects the volume of fluid the drug is dissolved in • The volume of distribution represents a volume that must be considered in estimating the amount of drug in the body from the concentration of drug found in the sampling compartment
The real Volume of Distribution has physiological meaning and is related to body water Total body water 42 L Plasma Plasma volume 4 L Interstitial fluid Interstitial fluid volume 10 L Intracellular fluid Intracellular fluid volume 28 L
Apparent Volume of Distribution • Drugs which binds selectively to plasma proteins, e.g. Warfarin have apparent volume of distribution smaller than their real volume of distribution • Drugs which binds selectively to extravascular tissues, e.g. Chloroquines have apparent volume of distribution larger than their real volume of distribution. The Vd of such drugs is always greater than 42 L (Total body water)
Apparent Volume of Distribution • Lipid solubility of drug • Degree of plasma protein binding • Affinity for different tissue proteins • Fat : lean body mass • Disease like Congestive Heart Failure (CHF), uremia, cirrhosis
Apparent Volume of Distribution • In general, drug equilibrates rapidly in the body. When plasma or any other biologic compartment is sampled and analyzed for drug content, the results are usually reported in units of concentration instead of amount • Each individual tissue in the body may contain a different concentration of drug due to differences in drug affinity for that tissue. Therefore, the amount of drug in a given location can be related to its concentration by a proportionality constant that reflects the volume of fluid the drug is dissolved in • The volume of distribution represents a volume that must be considered in estimating the amount of drug in the body from the concentration of drug found in the sampling compartment
Apparent Volume of Distribution: Mathematics • In order to determine the apparent volume of distribution of a drug, it is necessary to have plasma/serum concentration versus time data
Apparent volume of distribution estimation • Plot log(C) vs. time • Plot the best-fit line • Extrapolate to the Y-axis intercept (to estimate initial concentration, C0) • Estimate Vd:
1- Plot log(C) vs. time Log (Conc) Time
2- Plot the best-fit line Log (Conc) Time
3-Extrapolate to the Y-axis intercept (to estimate C0) Log (Conc) C0 Time
4-Estimate Vd Log (Conc) Log(C0) Time
Elimination rate constant (K) • Elimination rate constant represents the fraction of drug removed per unit of time • K has a unit of reciprocal of time (e.g. minute-1, hour-1, and day-1) • With first-order elimination, the rate of elimination is directly proportional to the serum drug concentration
Elimination rate constant estimation • Plot log(C) vs. time • Plot the best-fit line • Calculate the slope using two points on the best-fit line • Estimate K:
1- Plot log(C) vs. time Log (Conc) Time
2- Plot the best-fit line Log (Conc) Time
3- Calculate the slope using two points on the best-fit lin Log (Conc) (Log(C1), t1) (Log(C2), t2) Time
4- Estimate K Log (Conc) Time
Elimination half life (t1/2) • The elimination half life is sometimes called ‘‘biological half-life’’ of a drug • The elimination half life is defined as the time (h, min, day, etc.) at which the mass (or amount) of unchanged drug becomes half (or 50%) of the initial mass of drug
Elimination half life (t1/2) estimation • Two methods: • From the value of K: • Directly from Conc vs. time plot • Select a concentration on the best fit line (C1) • Look for the time that is needed to get to 50% of C1 half-life
Clearance (Cl) • Clearance is a measure of the removal of drug from the body • Plasma drug concentrations are affected by the rate at which drug is administered, the volume in which it distributes, and its clearance • A drug’s clearance and the volume of distribution determine its half life
Clearance (Cl) • Clearance (expressed as volume/time) describes the removal of drug from a volume of plasma in a given unit of time (drug loss from the body) • Clearance does not indicate the amount of drug being removed. It indicates the volume of plasma (or blood) from which the drug is completely removed, or cleared, in a given time period. • Figures in the following two slides represent two ways of thinking about drug clearance: • In the first Figure, the amount of drug (the number of dots) decreases but fills the same volume, resulting in a lower concentration • Another way of viewing the same decrease would be to calculate the volume that would be drug-free if the concentration were held constant as resented in the second Figure
Clearance (Cl) • the amount of drug (the number of dots) decreases but fills the same volume, resulting in a lower concentration
Clearance (Cl) • The most general definition of clearance is that it is ‘‘a proportionality constant describing the relationship between a substance’s rate of elimination (amount per unit time) at a given time and its corresponding concentration in an appropriate fluid at that time.’’ • Clearance can also be defined as ‘‘the hypothetical volume of blood (plasma or serum) or other biological fluids from which the drug is totally and irreversibly removed per unit time.’’
Clearance (Cl) estimation • For ALL LINEAR pharmacokinetics (including one compartment) , clearance is calculated using: where AUC is the area under the concentration curve (it will be discussed later)
Clearance (Cl) estimation • For One compartment pharmacokinetics , clearance is calculated using:
Clearance (Cl) • Drugs can be cleared from the body by different pathways, or organs, including hepatic biotransformation and renal and biliary excretion. Total body clearance of a drug is the sum of all the clearances by various mechanisms.
Elimination rate • The elimination rate at any time can be calculated using: • Elimination rate = K*X(t) OR • Elimination rate = Cl*C(t) where • X(t) is the amount of drug in the body at time t, • C(t) is the concntration of drug at time t
Area Under the Conc. Time Curve(AUC) calculation • Two methods: • Model dependent: can be used only for one compartment IV bolus • Model independent: Can be used for any drug with any route of administration
AUC calculation: Model dependent • With one compartment model, first-order elimination, and intravenous drug administration, the AUC can be calculated using:
AUC calculation: Model independent 1- Divide the area into different parts based on the observed concentration points (parts 1-5) 1 2 3 4 5
AUC calculation: Model independent 2- Calculate the area for each part of the parts 1,2,3 and 4 (until the last observed concentration) using trapezoidal rule 1 2 3 4 5
Trapezoidal rule(Trapezoid = شبه المنحرف) C1 C2 where C = concentration t = time t1 t2
AUC calculation: Model independent 3- For part 5 (area between the last observed concentration and infinity) use the following equation: C*
AUC calculation: Model independent 4- The total AUC (from zero to infinity) is the sum of the areas of parts: 1,2,3,4, and 5 1 2 3 4 5
Fraction of the dose remaining • Fraction of dose remainig (F = X(t)/X0) is given by the following equation: since t1/2= 0.693/k, the equation can be represented as: