Download
1 / 1
10 likes | 155 Vues
Trace data was aggregated to summary data per Run. Correlation analysis mainly shows correlations between summary data coming from the same process chamber and not in between deposition and etch back (processes independent).

E N D
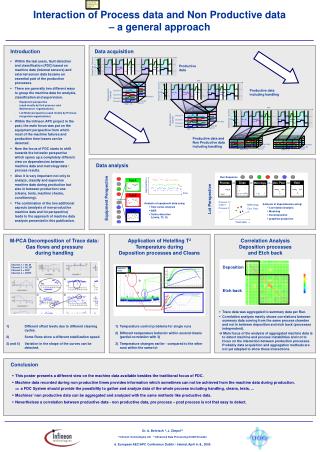
Trace data was aggregated to summary data per Run. Correlation analysis mainly shows correlations between summary data coming from the same process chamber and not in between deposition and etch back (processes independent). Main focus of the analysis of aggregated machine data is to detect machine and process instabilities and not to focus on the interaction between production processes. Probably data acquisition and aggregation methods are not yet adapted to show these interactions. time time Productiv Clean Channel n Channel n Channel n ..... ..... ..... .... .... .... ... ... ... .. .. .. Run #last Run #last Run #last Run #1 Run #1 Run #1 Run #2 Run #2 Run #2 Clean Clean Clean Run #last Run #last Run #last Clean Clean Clean Run #1 Run #1 Run #1 .. .. .. ..... ..... ..... ... ... ... .... .... .... Recipe Step Recipe Step Recipe Step Data acquisition Measurement Channel Measurement Channel Channel 1 Channel 1 Run #last Run #last Channel 2 Channel 2 Run #2 Run #2 Run #last Run #last Run #1 Run #1 time t /s time t /s Channel 3 Channel 3 Run #2 Run #2 Channel 4 Channel 4 Productive data Run #1 Run #1 time t /s time t /s Productive data including handling Productive data and Non Productive data including handling KeyNumber x Tool A time time Tool B Analysis of equipment data using • Time series analysis • WER • Outlier detection (Limits, T2, Q) Tool C Besser aufbereiten Schichtenmodell - Verenglischen und KommentaR UNTEN Interaction of Process data and Non Productive data– a general approach Introduction • Within the last years, fault detection and classification (FDC) based on machine data (internal sensors) and external sensor data became an essential part of the production processes. • There are generally two different ways to group the machine data for analysis, classification and supervision. • Equipment perspective (used mostly by Unit process- and Maintenance- organizations) • Lot/Wafer perspective (used mostly by Process integration-organizations) • Within the Infineon APC project in the past, the main focus was put on the equipment perspective from which most of the machine failures and production time losses can be detected. • Now the focus of FDC starts to shift towards the lot/wafer perspective which opens up a completely different view on dependencies between machine data and metrology data / process results. • Also it is very important not only to analyze, classify and supervise machine data during production but also in between production runs (cleans, tests, machine checks, conditioning). • The combination of the two additional aspects (analysis of non-productive machine data and lot perspective) leads to the approach of machine data analysis presented in this publication. Data analysis Run Sequence Process Clean ... elec. Para Yield Metrology Equipment Perspective Lot Perspective Process 1Clean 1 Process 2 ... Analysis of dependencies using: • Correlation Analysis • Modeling • Decomposition • graphical projection Metrology Elec. Para … Yield data, … M-PCA Decomposition of Trace data: Gas flows and pressureduring handling Application of Hotelling T2Temperature duringDeposition processes and Cleans Correlation AnalysisDeposition processesand Etch back Channel 1 = H2_M Channel 2 = H2_SP Channel 3 = DOP Channel 4 = CHPR Deposition Etch back 2) 3) 1) 2) 3) 4) 1) Different offset levels due to different cleaning cycles. 2) Some Runs show a different stabilization speed. 3) and 4) Variation in the shape of the curves can be detected. Temperature control problems for single runs Different temperature behavior within several cleans (partial correlation with 3) Temperature changes earlier - compared to the other runs within the same lot Conclusion • This poster presents a different view on the machine data available besides the traditional focus of FDC. • Machine data recorded during non productive times provides information which sometimes can not be achieved from the machine data during production. a FDC System should provide the possibility to gather and analyze data of the whole process including handling, cleans, tests, ... • Machines’ non productive data can be aggregated and analyzed with the same methods like productive data. • Nevertheless a correlation between productive data - non productive data, pre process – post process is not that easy to detect. Dr. A. Behrisch a, J. Zimpel b a Infineon Technologies AG b Advanced Data Processing GmbH Dresden 6. European AEC/APC Conference Dublin / Ireland, April 6.-8., 2005