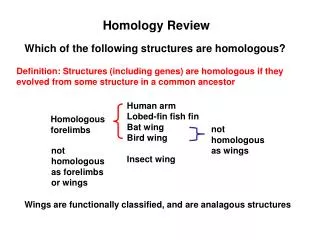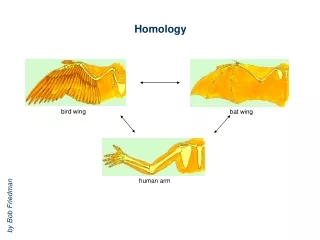
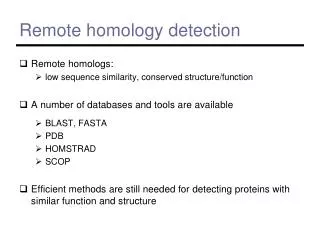
Remote homology detection
Remote homology detection. Remote homologs: low sequence similarity, conserved structure/function A number of databases and tools are available BLAST, FASTA PDB HOMSTRAD SCOP Efficient methods are still needed for detecting proteins with similar function and structure. SCOP Database.

Remote homology detection
E N D
Presentation Transcript
Remote homology detection • Remote homologs: • low sequence similarity, conserved structure/function • A number of databases and tools are available • BLAST, FASTA • PDB • HOMSTRAD • SCOP • Efficient methods are still needed for detecting proteins with similar function and structure
SCOP Database • SCOP: Structural Classification of Proteins Class Level Fold Level Superfamily Level Family Level
SCOP Database • SCOP: Structural Classification of Proteins Class Level • Based on arrangement of secondary structures • all-alpha • all-beta • alpha-and-beta (interspersed) • alpha+beta (segregated) • multidomain
SCOP Database • SCOP: Structural Classification of Proteins Class Level Fold Level Same secondary structures, arrangements, topology
SCOP Database • SCOP: Structural Classification of Proteins Class Level Fold Level Superfamily Level Structure and function suggest common evolutionary origin
SCOP Database • SCOP: Structural Classification of Proteins Class Level Fold Level Superfamily Level Family Level > 30% sequence identity or similar structure/function
SCOP Database • Another representation protein family superfamily
Classification problem • Given a query protein identify functionally similar proteins from a database of known proteins ?
Classification problem • Given a query protein identify functionally similar proteins from a database of known proteins • State-of-the-art methods employ Support Vector Machines (SVM) • Input: Set of labeled data points (positiveor negative) • Output: Model that correctly classifies both the original input data and new unseen data points • SVM finds a hyper-plane that separates the Input Data • The new points are classified with respect to the hyper-plane
SVM and Data representation • Each data point has to be represented as n-dimensional vector • this is called feature vector representation of the data • encodes information about properties of the data • Domain knowledge can/should be used to choose appropriate feature representation • Building SVM-based classifier Unseen Data Feature Representation SVM Training SVM-based Classifier Input Data
Outline • Related work • article classification • protein classification using sequence information • Proposed method • protein classification using structure information • Common thread • vocabulary – a set of possible features • feature vector – counts the number of times each feature occurs
Article classification • Categorizing Reuters articles(Joachims, 98) • Feature representation of articles • vocabulary is the set of all English words • feature vector represents the count of each word in the article 0 computer 2 dose 1 diet 0 felony . . . . . . . . 2 health 0 insurance 0 liquor 2 mouse . . . . . . . . 1 obese 1 paradox 3 red 3 wine Fat doses of red wine extract help obese mice stay healthy A daily glass of red wine was linked to beneficial health effects a decade ago. Long suspected of playing a role in the "French paradox" — a high- fat diet with no ill effects on longevity — resveratrol is found in red wine, sadly in doses about 300 times lower than in the mouse study.
Protein classification (sequence) • Categorizing proteins using sequence information(Leslie et al., 04) • Feature representation of proteins • vocabulary is all k-letter words from the amino acid alphabet • feature vector represents the count of each “word” in the protein 0 AAAA 0 AAAC 0 AAAD 0 AAAE . . . . . . . . 2 LVLH 0 LVL I 0 LVLK . . . . . . . . 0 WAKS 0 WAKT 2 WAKV . . . . . . . . LVLHSEGWAKVQLVLHVWAKVE . . . . .
03.8 6.5 4.1 4.6 2.7 5.3 2.9 4.1 • 3.8 03.4 2.8 6.4 2.9 3.3 1.9 3.7 • 6.5 3.4 03.7 5.8 2.8 5.7 1.8 2.6 • 4.1 2.8 3.7 03.1 2.2 7.0 4.2 5.3 • 4.6 6.4 5.8 3.1 03.8 6.5 4.1 3.0 • 2.7 2.9 2.8 2.2 3.8 03.4 2.8 4.8 • 5.3 3.3 5.7 7.0 6.5 3.4 03.7 2.1 • 2.9 1.9 1.8 4.2 4.1 2.8 3.7 0 3.5 • 4.1 3.7 2.6 5.3 3.0 4.8 2.1 3.5 0 • 0 3.8 6.5 4.1 4.6 2.7 5.3 2.9 4.1 • 3.8 0 3.4 2.8 6.4 2.9 3.3 1.9 3.7 • 6.5 3.4 0 3.7 5.8 2.8 5.7 1.8 2.6 • 4.1 2.8 3.7 0 3.1 2.2 7.0 4.2 5.3 • 4.6 6.4 5.8 3.1 0 3.8 6.5 4.1 3.0 • 2.7 2.9 2.8 2.2 3.8 0 3.4 2.8 4.8 • 5.3 3.3 5.7 7.0 6.5 3.4 0 3.7 2.1 • 2.9 1.9 1.8 4.2 4.1 2.8 3.7 0 3.5 • 4.1 3.7 2.6 5.3 3.0 4.8 2.1 3.5 0 D = D = D(i, j) = distance between amino acids i and j D(i, j) = distance between amino acids i and j Protein classification (structure) Protein classification (structure) • Categorizing proteins using structure information(Ilinkin, Ye, in progress) • Feature representation of proteins • vocabulary is all pairwise distances of k consecutive amino acids • feature vector represents the count of each “word” in the protein (3.8, 6.5, 4.1, 3.4, 2.8, 3.7) (3.8, 6.5, 4.1, 3.4, 2.8, 3.7) (3.4, 2.8, 6.4, 3.7, 5.8, 3.1) (3.7, 5.8, 2.8, 3.1, 2.2, 3.7) (3.1, 2.2, 7.0, 3.7, 4.3, 3.6) (3.8, 6.5, 4.1, 3.4, 2.8, 3.7) (3.8, 6.5, 4.1, 3.4, 2.8, 3.7) (3.6, 4.9, 4.8, 3.5, 2.1, 3.5)
+ + + + + + + + – – – – – + – + – – – – – – – – – train – – – – + + + + + + + + – – + + + – – – – – – – – – – – – – + – + – – – – – – – – – – – – – – – – – – – – – Feature Vectors and SVM Training – – – – – – – – – – – – – – – – test – – – – – + Classifier + – – + – Experimental setup • Given a query protein can we predict its superfamily (in or out) • Split the data into positive (in) and negative (out) examples • Reserve some of the data for testing ; rest is for training the SVM
Results • ROC curve plots true positive ratevsfalse positive rate • Area under ROC curve (ROC score) is a measure of the quality of classification • area is between 0 and 1 ; closer to 1 is better true positive Area under ROC false positive Experimental Results Sample ROC Curve