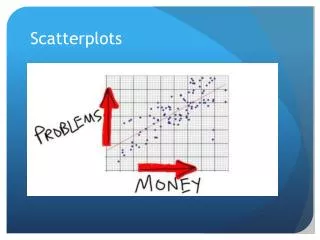
Scatterplots & Correlation
Scatterplots & Correlation. Section 3.1A. Relationships between two Variables. A study found that short women are more likely to have heart attacks than tall women…. Smokers on average die younger than nonsmokers….

Scatterplots & Correlation
E N D
Presentation Transcript
Scatterplots & Correlation Section 3.1A
Relationships between two Variables • A study found that short women are more likely to have heart attacks than tall women…. • Smokers on average die younger than nonsmokers…. • But – to make these conclusions we must first eliminate the effect of other variables.
Lurking Variables • Can strongly influence the relationship between two variables.
Scatterplot • Used to show the relationship between two quantitative variables measured on the same individuals. Each individual in the data appears as a point in the graph. • Explanatory variable goes on the horizontal axis. • If there is no explanatory variable then either variable can go on the horizontal axis.
Describe the correlation • Apples: circumference, weight • College freshmen: shoe size, weight • People: age, grip strength • Drivers: blood alcohol, reaction time
Caution….. Association does not imply causation!
Interpreting Scatterplots • Look for direction (positive, negative, none) • Look at the form of the relationship • Straight or curved • Any clusters • Look at the Strength • How closely does it follow the form • Look for outliers • Individual value hat falls outside the overall pattern of the relationship
When writing to describe: • There appears to be a (strong, weak, moderate) (positive/negative) (linear, nonlinear) relationship between _____ (give the x variable) and ______ (give the y variable) • Do not just say between x & y!
Interpret…. Direction Form Strength Outliers Influential Pt!
The following data represents 9th grade students who go on a backpacking trip.
Homework • Page 159 (1-13) odd