The Relationship Between Implicit and Explicit Gender
This study examines the relationship between implicit and explicit gender schemas through a two-dimensional model. Utilizing survey methods and the Implicit Associations Test (IAT), participants' reactions to feminine, masculine, and occupational preferences were measured. Results revealed unexpected correlations, challenging existing research on gender schemas. Limitations included an atypical gender distribution in participants. Future research directions aim to refine measurement techniques and improve sample representation. This work contributes to understanding gender roles and occupational preferences in contemporary society.

The Relationship Between Implicit and Explicit Gender
E N D
Presentation Transcript
The Relationship Between Implicit and Explicit Gender Jacob Cooper and Karin Schubert Hanover College 2009
Introduction • Gender Schema Theory (Bem, 1981): People internalize conceptions of gender as a means of organizing, processing, and interpreting information about their world or their selves. • Feminine: having qualities or attributes which are usually associated with females in this culture • Masculine: having qualities or attributes which are usually associated with males in this culture
Introduction • Tested differences between men and women (Lippa, 2006) • Behavior problems • Childhood behaviors • Sexual orientation • Sex drive • Social dominance orientation • Tendency of social-emotional vs. task-oriented behaviors • Occupational preference (Lippa, 1998) • Women prefer people-oriented occupations, whereas men prefer thing-oriented occupations (p < .0001). • How do researchers test for these differences?
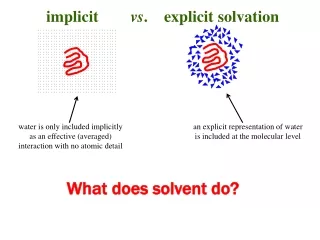
Explicit Measurement • Surveys or questionnaires • Rely on a participant's conscious, "explicit" attitudes and beliefs • Most common way of measuring gender schema • Limitations • Participants may alter responses • Only detect attitudes of which people are aware • BSRI (Sandra Bem, 1974)
Implicit Measurement • Implicit Associations Test (IAT; Greenwald, McGhee & Schwartz, 1998) • Automatic or implicit association between two factors Dog Dog/Good Cat/Good Good Cat Cat Cat/Bad Dog/Bad Bad Dog • Associations determined by reaction time • Quicker reaction times indicate a stronger association • Studies have shown IAT can be used to measure self-concept Meow Happy Bark Terrible Bark Meow Canine Love Feline Awful Happy Bark Meow Terrible
Greenwald and Farnham (2000) • Developed an IAT to measure gender schema • Feminine vs. Masculine • Self vs. Not-self • Represents a single bipolar model • Gender schema theory and the BSRI suggest using two unipolar measures, which would allow participants to be high in both masculinity and femininity. Feminine Masculine Not feminine Feminine Not masculine Masculine
Current Study • Communion and agency (Wiggins, 1991) • Communion: love, social interest, tenderness, trust, popularity • Agency: power, superiority, autonomy, status, dominance • Allows for two-dimensional model • Two IATs • Self and Communion • Self and Agency Low community High community Low agency High agency
Hypothesis • A two-dimensional model for measuring gender schemata will predict previously tested gender differences better than Greenwald and Farnham’s (2000) one-dimensional model.
Method • Participants • 51 undergraduate students at a small liberal arts college • 39 Female, 12 Male • Between ages 18 and 23 • Mostly Caucasian
Method cont. • Materials • Occupational Preference Survey • Prediger (1982), Lippa (1991, 1998) • People-oriented occupations: teacher, social worker, minister • Thing-oriented occupations: mechanic, carpenter, farmer • Implicit Gender Measures • Communion IAT • Caring • Not Caring • Self • Not self • Agency IAT • Powerful • Not Powerful • Self • Not self • Femininity IAT • Masculine • Feminine • Self • Not self
Method cont. • Procedure • Psychology computer lab • One computer per participant, maximum of 10 participants • Informed consent • Demographics • Occupational Preference Survey • Three IATs in counterbalanced order • Debriefing
Results • Calculating variables • Two critical trials • 1. Self & high communion word (“kind”) • 2. Self & low communion word (“aloof”) • A person high in communion would have a faster reaction time (RT) for pairing self & kind and a slower RT for pairing self & aloof • Communion score is calculated by: • (average RT for self & aloof) – (average RT for self & kind)
Results cont. • Three expected correlations • Communion & people occupations • r(51) = .065, p = .658 • Agency & things occupations • r(51) = .177, p = .218 • Femininity & people occupations • r(51) = -.163, p = .259
Results cont. t(47) = .359, p = .721
Results cont. t(48) = 2.258, p = .029
Results cont. t(48) = 1.154, p = .254
Results cont. • There was a significant correlation between people and things at r(51) = .317 at p = .025
Discussion • Results contradict previous research • Possible reasons for odd data • Participants with poor accuracy? • Average accuracies of less than 80% were excluded in analyses. • Abnormal sample of men? • Abnormal sample of women?
Limitations • Only 12 male participants • Floor effect for thing-oriented occupations • Thing-oriented occupations require less education • Instrument limitations
Future Directions More accurate measure of people-things occupation preference More representative sample Improved Implicit Associations Tests