
Experimental Characterization of Transitional Unsteady Flow in AV Graft-to-Vein Junction
This study investigates the hemodynamics within an arterio-venous (AV) graft-to-vein junction using in vitro modeling techniques. Utilizing advanced measurement technologies such as Laser Doppler Anemometry (LDA) and Color Doppler Ultrasound, findings reveal complex and pulsatile flow patterns that significantly influence wall shear stress (WSS) and the potential for graft failure due to turbulence and low WSS. The research emphasizes the interplay between flow dynamics and vascular health, providing essential insights for improving graft longevity in hemodialysis patients.

Experimental Characterization of Transitional Unsteady Flow in AV Graft-to-Vein Junction
E N D
Presentation Transcript
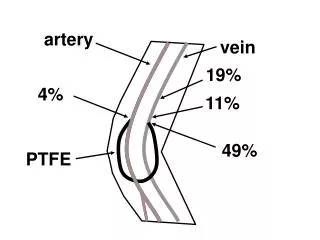
artery vein 19% 4% 11% 49% PTFE
Experimental Characterization of Transitional Unsteady Flow Inside a Graft-to-Vein Junction Nurullah Arslan Mechanical Engineering Department The University of Illinois at Chicago
Argon-Ion laser 750mW Downstream tank Upstream Tank LDA probe Radiator Heater 10% 90% Test section Ball valve Pump Ball valve
Color Doppler Ultrasound QMAX 2.5 l/min QMEAN 1.5 l/min QMIN 1 l/min 10%
Color Doppler Ultrasound QMAX 2.5 l/min QMEAN 1.5 l/min QMIN 1 l/min 10%
Arterio-Venous (A-V) Grafts Hemodialysis Patients Schmidt et al., Vascular Access for Hemodialysis, 1985
PTFE Graft just after Implantation(Reference: Access Surgery, 1982)
Arterial Bypass Graft Failure Hemodynamics low and oscillating WSS Tissue growth Thickening of the vessel wall Intimal Hyperplasia Stenosis (narrowing of the vessel) Failure Blockage stops blood flow Thrombosis (blood clot)
Arterial PTFE Graft Model(Loth et al.) Similar Geometry but different flow conditions Re=222
Results Under Arterial Flow ConditionsRemean=222(Loth et al.) Summary: 1) No Turbulence 2) No separation was observed 3) Flow was complex with strong secondary flow patterns 4) Pulsatility affected the flow field greatly (velocity profiles were more blunt) 5) WSS values were generally low in the anastomosis
Events Leading to AV Graft Failure Hemodynamics Turbulence & WSS Energy Transfer to the wall Tissue Vibration Enthothelial Cell Damage Tissue growth Thickening of the vessel wall Intimal Hyperplasia Stenosis (narrowing of the vessel) Increased turbulence Platelet activation Failure Blockage stops blood flow Thrombosis (blood clot)
Canine AV Graft Study (A) 3-D schematic representation of perianastomotic tissue vibration. (B) Schematic representations of longitudinal (C) Transverse views of perianastomotic tissue vibration Fillinger et al., Hemodynamics and Intimal Hyperplasia, 1991
Stenosis Location inside the A-V graft Thickness (mm) Re10-3
Fillinger Concluded 1) Tissue vibration 2) Reynolds Number intimal hyperplasia at the venous anastomosis
Other AV Graft Model Studies(No turbulent measurements) • Velocity measurements and WSS estimation (Shu et al.) • Velocity patterns by flow visualization (Krueger et al. ) • Flow patterns using flow visualization (Bakran et al.)
Turbulence Studies • Turbulence measurements in constricted tubes (Deshpande et al., 1980, Jones et al., 1985, Kehoe et al., 1990) • High Reynolds stresses may cause red blood cell damage and platelet activation (Sutera, S.P. and Mehrjardi, M.H., 1975) Stenosis
Objective To determine the distribution of turbulence and Reynolds stresses within the an AV graft using in vitro modeling techniques
Summary of In Vivo Measurements Patient II Patient I Graft Diameter(mm) 6 6.7 Umax(m/s) 1.5 1.2 Umin(m/s) 1 0.8 Remax 27002400 Remin 18001600 Qmax(ml/min)2544 2525 Qmin(ml/min)1696 1683 Womersley number() 4.8 5.3 Re = VD/, Q = VA, A = R2 = R(2 f/µ)1/2 µ=3.5 mPa/s, =1.05 g/cm3
In Vitro MeasurementsBifurcation plane and planeFlow Division: DVS:Graft = 10:90 Steady Flow Re = 1060, 1820, 2530, 2720 umean, vmean, urms, vrms, u´v ´ Pulsatile Flow Repeak= 2470, Remean= 1762 uens, vens, urms, vrms, u´v´ as ƒ(t)
Measurement Locations in A-V Graft x indicates measurements lines perpendicular to the plane of bifurcation
Velocity Profiles at Graft Inlet and DVS Re=1060 GRAFT inlet DVS
Velocity Profiles at Graft Inlet and DVS Re=2530 DVS GRAFT inlet
In Vitro Flow Wave Form at Graft inlet and DVS (Graft:DVS = 85:15)
Results Under AV Flow Conditions 1) Separation 2) Turbulence 3) Secondary Flow 4) Pulsatility 5) WSS
~0.1 Dv Toe <1.0 Dv PVS Separation Bubble
Mean Velocity in the Plane to the Bifurcation Plane Re=1060 and 2530
Results Under AV Flow Conditions 1) Separation small region near the toe creating a low WSS region 2) Turbulence (Urms, Vrms, and RS) 3) Secondary Flow 4) Pulsatility 5) WSS
Urms at the Perpendicular Plane Re=1060 and 2530
Vrms at the Perpendicular Plane Re=1060 and 2530
Reynolds Stress( )at the Perpendicular Plane Re = 1060 and 2530
Results Under AV Flow Conditions 1) Separation small region near the toe creating a low WSS region 2) Turbulence high Urms,Vrms, RS at these Re #s and localized near the toe 3) Secondary Flow 4) Pulsatility 5) WSS
V component of the Velocity, Perpendicular to Bifurcation Re=1060
Results Under AV Flow Conditions 1) Separation small region near the toe creating a low WSS region 2) Turbulence high Urms,Vrms, RS at these Re #s and localized near the toe 3) Secondary Flow strong and complicated 4) Pulsatility 5) WSS
Velocity Profiles at Systolic Peak and Diastole Systolic Peak Diastole
Turbulence Intensity for Pulsatile Flow Repeak = 2470 x/D=+1.2 Toe side Floor side