GIS Lab slides
This presentation delves into the critical differences between data and information, emphasizing their roles in decision-making, particularly within Geographic Information Systems (GIS). We examine the transformation of raw data into actionable information, the characteristics that define data and information, and the variety of data types used in GIS, including tabular, image, and vector data. Through examples and visualizations, discover how GIS integrates geographic and descriptive data to support diverse applications such as urban planning, emergency response, and public health.

GIS Lab slides
E N D
Presentation Transcript
GIS Lab slides Updated January 2010
Part 1: Data vs. Information • Data: raw facts or measurements • Information: collection of facts organized/processed in such a way that they have value beyond the facts themselves. • Adds meaning or context to achieve goal of user. • 58008?? What is this?
Data vs. information • Set of names in any order / class list • Set of numbers / grades for lab “When you control the the mail you control... information!”
Information is the derivative of manipulating, organizing, summarizing, and presenting data in a form suitable for decision-making or further analysis.- Hutchinson/Coulthard
Principle • MIS: The value of information is directly linked to how it helps decision makers achieve the organization’s goals
The “Information Spectrum” • . Omniscience • . Wisdom • . Knowledge • . Information • . Data
Part 2: Data and Information characteristics Often a trade-off between some of these attributes. Which ones are critical to your application?
Friends …. • Secure and Reliable • Timely and Accessible • Reliable and Simple
And Enemies • Accessible vs. Secure • Reliable/Accurate/Complete vs. Economical
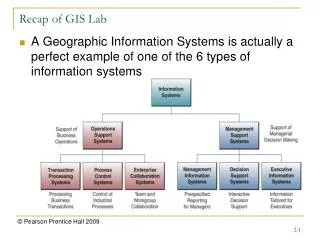
PART 3: What is GIS? • A Geographical Information System (GIS) is a compilation of computer hardware, software, data and personnel that collects, analyzes and presents information that is tied to a geographic location. • Converts data into visual form • Links geographical data with descriptive data and forms the information into layers (coverages). • The layers create themes that represent particular features on a map and, when combined, form a complete picture.
Spatial Made up of points lines and areas: Points- locations: buildings, customers etc. Lines- streets, rivers. elevations Areas- polygons representing states, counties, market areas etc. Three Types of Data • Tabular • Lists, spreadsheets and databases • Can be linked to spatial data • Sales to a region • Image • Satellite images, aerial photographs and scanned data • One layer • Cannot be broken down
Vector- spatial x,y coordinates Structured coordinates represent the shape of a feature. Highways, rivers etc. Raster - image Matrix of cells with values Satellite imagery Color-coded to create a 3 dimensional image (elevations) Digital camera, TV Data Models
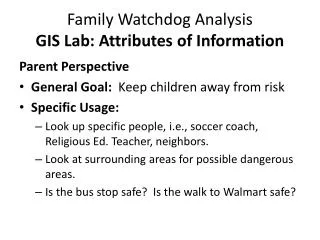
Uses • Business Placement • Law enforcement • Emergency Response • Census/Demographics • Marketing • Pollution remediation • Medical (disease epidemiology) • Facility management (utilities) &Much More!
The original map drawn by Dr. John Snow (1813-1858), a British physician, showing cases of cholera in the London epidemics of 1854, clustered around the locations of water pumps. (Wikipedia)
Allow Pop-ups for these • Albany crime spots (updated weekly) • Sex offenders map for a Zip Code
GIS Lab • MapInfo overview • Scavenger hunt – use MapInfo to answer geography questions • Map of WTC and Fire Companies • Metadata • Thematic map of male:female ratio • Use one screen to view instructions, other computer to do work