
Uploaded by
jaxon
1 SLIDES
196 VUES
10LIKES
cvr218supp_fig
DESCRIPTION
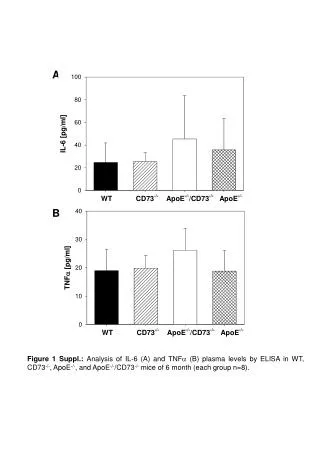
A. B. Figure 1 Suppl.: Analysis of IL-6 (A) and TNF a (B) plasma levels by ELISA in WT, CD73 -/- , ApoE -/- , and ApoE -/- /CD73 -/- mice of 6 month (each group n=8).
Download
1 / 1
Télécharger la présentation 
cvr218supp_fig
An Image/Link below is provided (as is) to download presentation
Download Policy: Content on the Website is provided to you AS IS for your information and personal use and may not be sold / licensed / shared on other websites without getting consent from its author.
Content is provided to you AS IS for your information and personal use only.
Download presentation by click this link.
While downloading, if for some reason you are not able to download a presentation, the publisher may have deleted the file from their server.
During download, if you can't get a presentation, the file might be deleted by the publisher.
E N D
Presentation Transcript
A B Figure 1 Suppl.: Analysis of IL-6 (A) and TNFa (B) plasma levels by ELISA in WT, CD73-/-, ApoE-/-, and ApoE-/-/CD73-/- mice of 6 month (each group n=8).
More Related