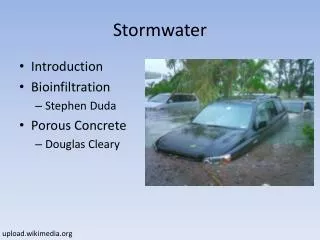
Bacterial Source Tracking in Stormwater
240 likes | 260 Vues
Learn about using bacterial and viral fecal indicators for pollution source identification in urban watersheds and enhancing water quality. Explore methods like qPCR and PhyloChip to pinpoint sources. Contact Calista Mills or Troy Pierce for more information.

Bacterial Source Tracking in Stormwater
E N D
Presentation Transcript
Bacterial Source Tracking in Stormwater http://rgvstormwater.org/wp-content/uploads/2017/06/LM-presentation_2017.xps Calista Mills, Physical Scientist USEPA, Gulf of Mexico Program
Bacterial Source Tracking in Stormwater Calista Mills, Physical Scientist USEPA, Gulf of Mexico Program
Gulf of Mexico Program Email houge.rachel@epa.gov to sign up for the RFP email list Coastal habitat & ecosystem enhancement, restoration &/or protection Environmental Education & Outreach Water Quality Improvements Community Resilience
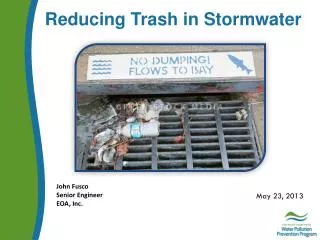
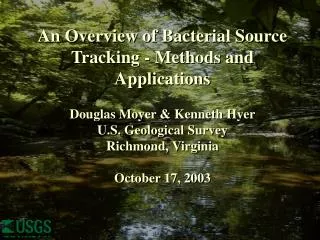
Turkey Creek RARE • Regional Applied Research Effort • use bacterial & viral fecal-indicators & landscape tools to identify & pinpoint pollution sources in an urban watershed
Turkey Creek RARE • Impaired - high fecal • Cooperate with state & local partners • Take quality assured data with local residents/students • Provide data for local Gulf decision makers
Turkey Creek RARE: E. coli Add bacterial growth media (food) to 100 ml sample E. coli assays fluoresce under UV light Sterile bottle sample collection
Virology • The plate shows viral plaques (red dots) • The next step is to determine sources of these fecal viruses
Microbial Source Tracking • DNA from target animals or bacteria is released into the water. • Sample is collected and DNA is extracted. • Specific sequences are amplified and identified. • Source determination is made. Microbial fecal- indicators in water and sediments Biofilm, water or sediments
MST: qPCR • EPA qPCR Methods • One genetic sequence per method • $375 per sample per species
MST: Phylochip • Phylogenetic Microarray • developed by Gary Anderson at UC Berkeley • profile over 60,000 bacterial taxa in one test Images: LBNL
MST: PhyloChip • qPCR on a large scale • Over 1 million genetic probe sequences including controls • Developed using 80 fecal reference libraries • $500 per sample, batches of 10 Image: LBNL
Unique 25 base DNA probe designed for each species from database Fluorescent antibody bound to probes with match Images: LBNL
Bird Horse Cow Pig Dog/Cat Human Images: LBNL
Bacterial Animal Sources Images: EPA R7
Generating a profile Source fingerprint Hybridization intensity Bacterial species (probes) Image: LBNL
Extract DNA/RNA from filtered sample Amplify with PCR Analyze composition Profile of entire community Images: LBNL
Performance evaluation • Blinded study: 41 different methods, 12 fecal sources, 64 unknowns • 100% correct identification of all dominant sources with PhyloChip • PhyloChip identified all sources, including sources with no specific markers available (e.g. deer, chicken) Cao et al. 2013. Water Research 47: 6862-6872 Images: LBNL
Case Study Both beaches exceed water quality limits for fecal indicator bacteria Horseshoe Cove * Baker Beach * Images: LBNL
Case Study Fecal signal from different sources Images: LBNL
The future for you • PhyloChip can be tailored for specific analysis • The goal of this evaluation is to develop a chip that costs under $100 per sample. • Regional sewage libraries for hot topic animals • Ask for next gen MST – OECA will give next gen dollars to run samples in your region.
Contact: Calista Mills, EPA Gulf of Mexico Program, mills.calista@epa.gov Troy Pierce, EPA Gulf of Mexico Program, pierce.troy@epa.gov
Microarray Microarray generates massive amounts of data. Microarray can produce results in more diverse samples. over 60,000 bacterial taxa $500 per sample qPCR • qPCR highly sensitive. • qPCR can be tailored to very specific targets. • One DNA sequence • $375 per sample