Download
1 / 54
540 likes | 707 Vues
The Peak Oil Debate Will global oil production start its final decline soon, or not? Bruce Robinson Convenor, ASPO-Australia. www.ASPO-Australia.org.au An Australia-wide network of professionals working to reduce oil vulnerability. ASPO-Australia Working groups Finance Sector

E N D
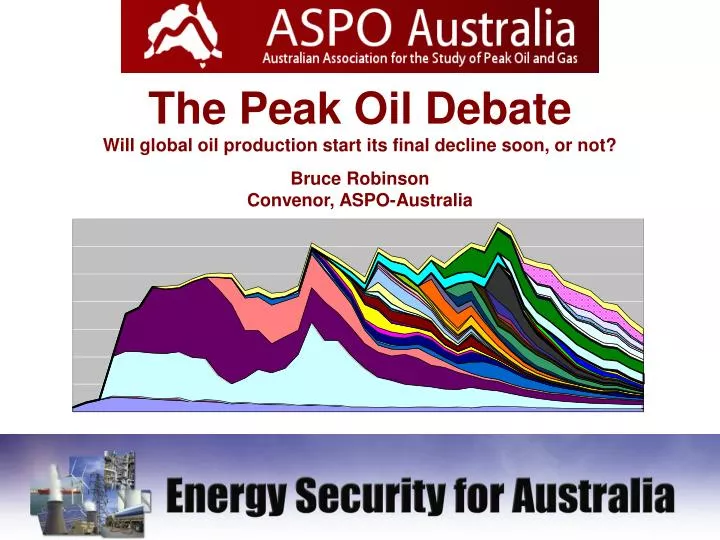
The Peak Oil Debate Will global oil production start its final decline soon, or not? Bruce Robinson Convenor, ASPO-Australia
www.ASPO-Australia.org.au An Australia-wide network of professionals working to reduce oil vulnerability ASPO-Australia Working groups Finance Sector Health Sector Social Services Sector Remote indigenous communities Active transport (bicycle & walking) Agriculture, Fisheries and Food Biofuels Urban and transport planning Oil & Gas industry Behavioural change Local Government sector Regional and city working groups Construction Industry Freight sector Public transport sector Defence and Security Economics Tourism Young Professionals working group Senate inquiry submission Senate Inquiry into Australia's future oil supply and alternative transport fuels ASPO-Australia is part of the international ASPO movement
Peak Oil but when? 2050 2010 1970 1930 Outline What is Peak Oil ? the time when global oil production stops rising and starts its final decline We will never "run out of oil" When is the most probable forecast date ? perhaps 2010-2015 What might it mean for Australia's Energy Security? lots! What mitigation and adaptation strategies are practical?
Many books about Peak Oil Brian Fleay Perth 1995 2005 Campbell & Laherrère March 1998 Deffeyes 2001 2006 Heinberg 2003 Campbell 2003 Roberts 2004
APPEA April 2005 Perth Australian Petroleum Production & Exploration Association conference • Please put your hand up if you thinkthat we have crossed the Hubbert Peak and we are entering a demand driven pricing era, • and hands up those who don’t? • Undecided • 1/3rd • 1/3rd Eric Streitberg Executive Director ARC Energy Limited • 1/3rd
US oil production: Peak in 1970 2002 Mb/d Jeremy Gilbert, ex BP www.PeakOil.net
Past World Oil Production and Forecasts Dr Ali Samsam Bakhtiari Iran 4 4 IEA 40 Prof. Bauquis France Shell 0 0 3 3 30 Deffeyes Bauquis, Total 0 0 Gb pa 2 2 20 ASPO & Skrebowski 0 0 1 1 10 0 0 2005 0 0 0 0 1930 1970 2010 2050 Chris Skrebowski UK Prof. Aleklett, ASPO Sweden 1 1 2 2 4 4 6 6 8 8 10 10 12 12 1 1 1 1 1 1 1 1 1 1 1 1
Chris Skrebowski Editor, Petroleum Review, LondonThe practical realities • The world needs oil production flows • Consumers need delivery flows • Reserves are only useful as flows • Worry aboutflows not reserves "40 years reserves left at current production rates" ....This is a very misleading statement
Alaskan North Slope ProductionReserves grow -- Production falls Prudhoe Bay, Alaska
A simple observation -- or why peak will be earlier than most people expect ‘Global production falls when loss of output from countries in decline exceeds gains in output from those that are expanding.’
Why are oil supplies peaking? • We are not finding oil fast enough • We are not developing fields fast enough • Too many fields are old and declining • We are short of people and equipment • Oilfield inflation is soaring
The real oil discovery trend Longwell, 2002
The real oil discovery trend Longwell, 2002 1995-2025 Discovery Forecast USGS
Global new field discovery (7-10bn b/y) Tar sands and Heavy oil Biofuels + others Known oil reserves in production (90%) NIP 10% EOR Yet-to-find probable Yet-to-find possible Current supply 84mn b/d or 30bn b/y 2 to 25 years Oil production flows -- all new flows take two to twenty-five years
How old are the fields? • Of the 18 largest fields, 12 are in decline, 5 have some potential and 1 is undeveloped • The 120 largest fields give 50% of total • 70% of production from fields 30+ years old • Few large recent discoveries • Relying more and more on ageing fields and new small discoveries
What are the BP statistics saying? • OECD production peaked in 1997 and has now declined by just under 2 million b/d (8.8%) • Non-Opec, non-FSU production peaked 2002 • North America/Mexico peaked in 1997 • North Sea - UK/Norway/Denmark peaked in 2000 now declined by 1.2 million b/d (19.2%) • Around 25 significant producers in decline • About 28% of global production from decliners
The UKCS depletion reality -- production down to 1mn b/d by 2010 UK North Sea
North Sea production by field Forties monthly production to date
1970 The top five decliners in 2005
How the Megaprojects database is created and used • All publicly available data • 2006-2012 148 Opec and 70 non-Opec projects • Opec data (from their website) • Incremental production allocated by start up date • Graphed to show volumes available to meet demand Megaprojects Report, Petroleum Review April 2006
Chris Skrebowski's conclusions • Supply will remain tight and prices high barring a major economic setback • Oil supply will peak in 2010/2011 at around 92-94 million barrels/day • Oil supply in international trade may peak earlier than the oil production peak • Collectively we are still in denial • WE HAVE JUST 1,500 DAYS TO PEAK
ABARE forecasts "Forecasters' Droop" ?? ASPO Random number generator "If the price of eggs is high enough, even the roosters will start to lay." ABARE to Senate inquiry into Australia's future oil supplies
NYMEX US$67 in 2011 now US$64.5 ABARE 2005 US$35 in 2006 ABARE US$39 in 2011 ABARE oil price forecasts US$/bbl 2002 for 2004 $26 2004 for 2005 $32 2004 for 2005 $37.95 – 4.8%
Australia’s oil production and consumption 1965-2030 Actual Forecast 1.0 Million barrels/day Consumption 0.8 0.6 Production 0.4 P50 0.2 0.0 1965 2005 2025 1985 Geoscience Australia, APPEA, ABARE
=1.3 EfT3 Australia uses 45,000 megalitres of oil each year a 360m cube Sydney Harbour Bridge is 134 m high 80% of Australia’s oil usage is in transport If Australia’s 20 M tpa wheat crop → ethanol = 9% 100 ml of oil contains 1 kWh of energy. Enough to move a small car to the top of the Eiffel tower
Million barrels/ day 2005 BP Statistical Review, 2006 Australia uses 0.9 China 7.0 US 20.6 World 82.5 US 1 cubic km oil / year 1 km l l China Australia United States
Total Oil Consumption Production Net imports M bbl/day China 20 EU 15 + Norway Australia 10 l l 1 km United States 0 Aust Eu-15+ USA China Japan Aust Eu-15 USA China Japan Oil consumption bbl/day/1000 people Registered vehicles /1000 people 70 60 50 40 30 20 10 0 Aust Eu-15 USA China Japan
ENERGYFILES www.energyfiles.com Energyfiles Ltd Oil production is not shared equitably US: 5% of world's population uses 25% of world oil China: 21% 8%
1000 Barrel/day UK Consumption Export/Import Production decline rate ~ 10% UK will be a net importer by 2007 Quelle: BP Analyse: LBST, ß
1000 Barrel/day Indonesia Consumption Export Quelle: BP 2003; Analyse: LBST, ß
2020 Consumption 1000 Barrel/day China Production Imports Data: BP. Analyse: Zittel LBST, ß, Pang Xiongqi
Common Myth Leonardo Maugeri ENI SPA Rome 15th December 2003 Economist Ultra-optimist “..just as the Stone Age did not end for the lack of stones, the Oil Age will not end because of the scarcity of oil. Rather oil will inevitably be surpassed in convenience by a new source of energy in the future”. BiomassWalking, horses, horse & cart, horse-drawn barge Coal Trains Oil (& gas) Cars, trucks, trains, planes ?? Is there anything else better than oil & gas ?? or even as good ? Thermodynamics? Theology?
12th January 2004 Realist ?, Pessimist ? Richard Miller BP Exploration Operating Co. Ltd. Middlesex, UK …oil, the most energy-dense of the natural, non-nuclear fuels on the planet.. But there isn't anything conceivable that could replace conventional oil, in the same quantities or energy densities, at any meaningful price…
2005 Study 35 EOR Coal Liquids 25 Impact (MM bpd) Heavy Oil 15 GTL 5 Efficient Vehicles 0 0 5 10 15 20 Years After Crash Program Initiation Worldwide Crash Program Mitigation of Conventional Oil Production Peaking A Study for DOE NETL Hirsch et al., 2005 Delay / Rapid growth. Roughly 35 MM bpd at year 20.
Les Magoon, USGS 2001 Is there a possible transition to another fuel?. Probably not. Can we run ALL our cars on water, hydrogen, ethanol, GTL ?? No. EROEI (Energy return on energy invested) Very important
December 2005 July 2006
The Peak Oil Debate Will global oil production start its final decline soon, or not? Probably yes. As the Senate report shows, the "no-worries" camp are remarkably short on reliable future production data and remarkably long on hope. What should we do.? Governments and businesses should each set up an "Office of Oil Vulnerability" to help people plan for the probability of Peak Oil. There are many options useful for mitigation and adaptation. No "Silver Bullet", but "silver buckshot" Oil vulnerability risk assessment and management is an important mechanism of minimising exposure and maximising opportunities. It is a new and promising field. Hint: Check your superannuation is not being invested into urban toll-roads, tunnels and airports. offshore onshore ENERGYFILES www.energyfiles.com Bruce.Robinson@ASPO-Australia.org.au 08-9384-7409 0427 398 708 www.ASPO-Australia.org.au
a few more slides follow, in case they are needed for questions
February 2004 By 2015, we will need to find, develop and produce new oil and gas equal to eight out of every 10 barrels being produced today.
Gboe/pa World All Oil } Oil 2005 www.PeakOil.net Association for the Study of Peak Oil & Gas, 2004
Gboe/pa World All Oil & Gas (gas at 10,000 cft=1bbl) } Gas } Oil 2005 www.PeakOil.net ASPO 2004
} Gb/year 50 Demand Trend World oil shortfall scenarios 40 Shortfall Past Production of Oil 30 20 Forecast Production 10 2005 2030 0 By 2030, the gap is equivalent to 6,000 nuclear reactors
Gb/year Efficiency Demand Growth World oil shortfall scenarios Transport mode shifts Pricing / taxes City design/lifestyle Past Production of Oil Other petroleum fuels gas, tar-sands Other fuels Deprivation, war Forecast Production 2005 • no single “Magic Bullet” solution, • probably no replacement ever for cheap plentiful oil • Urgent preparation and adjustment are vital
Demand Past Oil Production and Forecasts Australia Geoscience Australia Total Bass Strait 1970 1930 2010 2050 4 4 IEA 40 Shell World ASPO and others 0 0 3 3 30 Bauquis 0 0 Gb pa Samsam Bakhtiari 2 2 20 Deffeyes ASPO 0 0 1 1 10 0 0 2005 0 0 0 0 1930 1970 2010 2050 1 1 2 2 4 4 6 6 8 8 10 10 12 12 1 1 1 1 1 1 1 1 1 1 1 1
Australian Government Policy and Action Options 1: “Talk about it, Talk about it” 2. Engage people, “Participatory democracy” 3. Dismantle the "perverse policies" that subsidise heavy car use and excessive freight transport. 4. Encourage frugal use of fuel, and disadvantage profligate users. Fuel taxes should be incrementally raised to European levels to reduce usage. 5: SmartCard personal fuel allocation system. A flexible mechanism for short-term oil shocks, as well for encouraging people to reduce their fuel usage.. 6. Concentrate on the psychological and social dimensions of automobile dependence, not just “technological fixes” 7. Implement nationwide "individualised marketing" travel demand management. 8. Railways, cyclepaths and public transport are better investments than more roads. 9. Give priority for remaining oil and gas supplies to food production, essential services and indigenous communities, using the Smart-Card system. 10. Review the oil vulnerability of every industry and community sector and how each may reduce their risks. 11 Promote through the United Nations an Intergovernmental Panel on Oil Depletion, and a Kyoto-like protocol to allocate equitably the declining oil among nations. An international tradable sliding scale allocation mechanism is one hypothetical option.
Australia US China
ENERGYFILES www.energyfiles.com