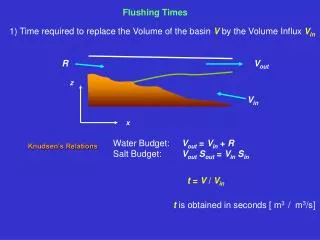
Flushing Times
1) Time required to replace the Volume of the basin V by the Volume Influx V in. R. V out. z. V in. Water Budget: Salt Budget:. V out = V in + R V out S out = V in S in. x. Flushing Times. Knudsen’s Relations. t = V / V in. t is obtained in seconds [ m 3 / m 3 /s].

Flushing Times
E N D
Presentation Transcript
1) Time required to replace the Volume of the basin V by the Volume Influx Vin R Vout z Vin Water Budget: Salt Budget: Vout = Vin + R Vout Sout = Vin Sin x Flushing Times Knudsen’s Relations t = V / Vin t is obtained in seconds [ m3 / m3/s]
Volume of fresh water in the system (m3) River flow (m3/s) The freshwater fractionf is given by: average freshwater fraction Could use salinity between head and mouth to get Flushing Times 2) Time required to replace the fresh water volume in the estuary by the river flow 3) Same as 2) but using the concept of freshwater fraction to determineVf Define oceanic salinity as σ and salinity at any part of the estuary as S If f = 0, all salty water; if f = 1, all fresh water
hw Vp Volume of tidal prism Volume of fresh water VR hl z S = 0 S = σ x 4) Flushing by Tides (Tidal Prism Method) Tides bring oceanic water into the estuary during flood. The volume of this oceanic water Vp is equal to the difference between high hw and low hlwater multiplied times the surface area A of the estuary; Vp = (hw – hl ) A Assume: - no variations of depth along the estuary short estuary - over a full tidal cycle, Vp is entirely mixed with VR - entire volume of mixed water is removed from estuary during ebb - on the next flood the process is repeated with seawater of S = σ entering the estuary Water going in has oceanic salinity; water going out has mixed S = Š
Flushing by Tides (Cont.) hw Vp Volume of tidal prism Volume of fresh water VR hl z S = 0 S = σ x The average Š of the mixed water at high tide is given by: The mean fresh water fraction is: If Vp >> VR , then Š σ If VR>>Vp , then Š 0 which includes River and Tidal effects
Flushing by Tides (Cont.) Taking our definition 3): Tis the tidal period, i.e., the characteristic period of tidal exchange Flushing time by the tidal prism It would take a lot of T scales to flush the system if V >> Vp + VR Drawbacks: -complete mixing from head to mouth of waters entering estuary; this shortens tT relative to real tT -no atmospheric forcing -water coming in is of oceanic salinity, which is usually not the case tT should be < t[t as derived from (1), (2) or (3)]
and the Flushing rate due to tidal prism FT In the case of a dye, if we release a dye of concentration C (in mass percentage) at a constant rate D (in kg/s): Flushing Rates Flushing rateF - rate at which the total volume of the estuary is exchanged FT should be > F
Pi Vi Let, Pi = intertidal volume for segment i (or tidal prism + VR) Vi = low water volume Flushing Rates in Sections (or segments) Modify tidal prism method by dividing the estuary into segments over which mixing takes place, rather than assume that there is complete mixing over the length of the estuary during each tidal cycle. The length of each segment is determined by the tidal excursion (Uo T / π). At the landward end: Vi= V0 -- low tide volume Pi= P0 = VR -- over a tidal cycle; provided by the river discharge
Pn -1 Vn -1 Vn Therefore, Flushing Rates in Sections (or segments) For the succeeding segments, assume that the high tide volume of the landward section is the low tide volume of the seaward section. This implies that the tidal excursion decreases landward or that the channel gets narrower.
If the water within each segment is completely mixed at high tide, the proportion of water removed on ebb tide will be given by the ratio between intertidal volume and the high tide volume of the segment, or exchange ratio of segment ‘n’ rn: Pn -1 Modified Tidal Prism High Tide Volume Vn -1 Vn Using: Volume of basin / (tidal prism + fresh water volume) or High Tide Volume / Modified Tidal Prism Flushing Rates in Sections (or segments) If Vn = 0 (as in a tidal flat) rn = 1
Accumulated freshwater in each volume segment: Finally, Flushing Rates in Sections (or segments) Reference on Residence Time: Sheldon, J.E. and M. Alber (2002), A comparison of residence time calculations using simple compartment models of the Altamaha River Estuary, Georgia. Estuaries, 25:1304-1317.
Tejo Estuary, Portugal Residence Times (days) (following particles with a numerical model) Anabela Pacheco de Oliveira Refer to to Tomczac’s page for more information on Flushing Times . 5) Flushing times from particle tracking in numerical models
Vancouver Seattle Residence time in Willapa Bay (Banas & Hickey, 2005, JGR, 110, 11011)
Maps of water age calculated by a numerical model for Willapa Bay (Banas and Hickey, J. Geophys. Res., 2005, 110, C11011.
Flushing time in Mururoa Atoll Lagoon a coral island in Polynesia previously used for nuclear tests, determined from a numerical model © 2000 M. Tomczak bathymetry The model takes into account tides and wind-driven water movement and includes flow over the coral reef as well as through the access channel. The figure on the left shows the circulation in the form of streamlines along which the water circulates. The zero streamline separates anti-clockwise circulation near the channel from clockwise circulation in the lagoon. Notice that most of the lagoon circulation is closed, so exchange with the ocean can only occur through turbulent diffusion across streamlines.The figure on the right shows the water residence time or flushing time in days. Most of the lagoon is flushed within less than 100 days, but there is a less well flushed region in the east where the flushing time exceeds 140 days.
4) Consider these relationships a step further in terms of the Equivalent Downstream Transport represented byQd f = 1 f = 0.5 f Qd is a fictitious quantity; it could be measured under unusual circumstances. It is an expression in terms of the advective and diffusive effects R R S = 0 z R x Qd = 2R Qd = R / f Qd = R Flushing time α Qd / R = 1/ f It measures the combined effects of advection and diffusion in removing a pollutant in an estuary, compared to advection only The greater Qd (small f ), the longer the flushing time