
Comprehensive Guide to Phylogeny Inference with PHYLIP Programs
E N D
Presentation Transcript
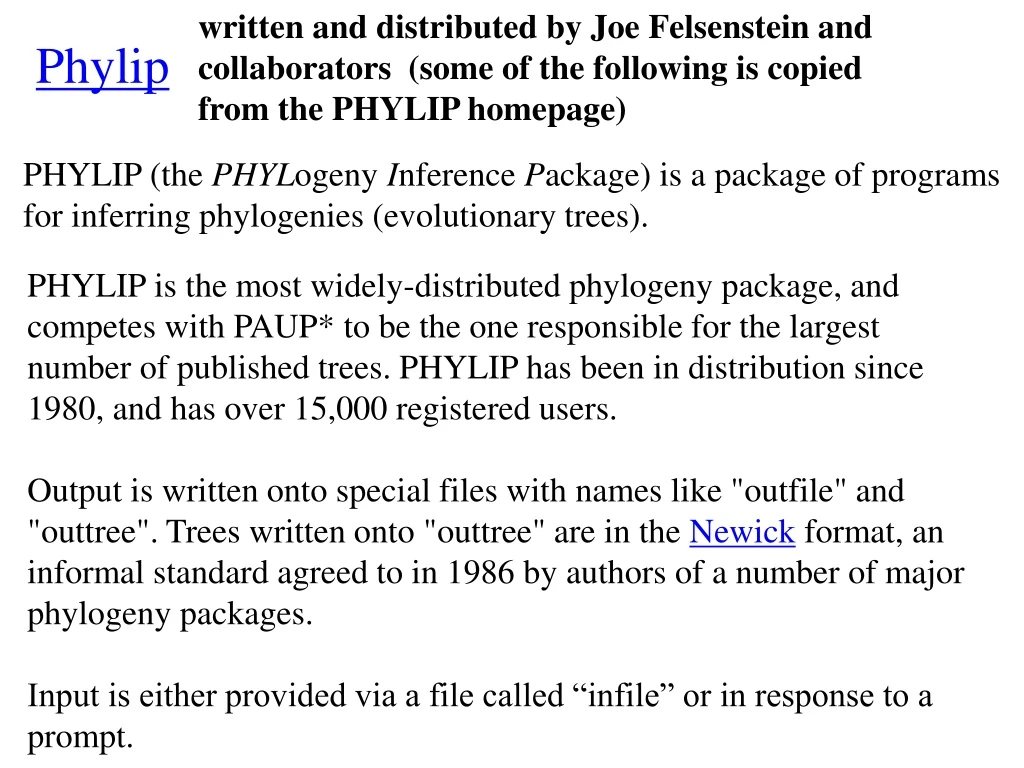
written and distributed by Joe Felsenstein and collaborators (some of the following is copied from the PHYLIP homepage) Phylip PHYLIP (the PHYLogeny Inference Package) is a package of programs for inferring phylogenies (evolutionary trees). PHYLIP is the most widely-distributed phylogeny package, and competes with PAUP* to be the one responsible for the largest number of published trees. PHYLIP has been in distribution since 1980, and has over 15,000 registered users. Output is written onto special files with names like "outfile" and "outtree". Trees written onto "outtree" are in the Newick format, an informal standard agreed to in 1986 by authors of a number of major phylogeny packages. Input is either provided via a file called “infile” or in response to a prompt.
What’s in PHYLIP Programs in PHYLIP allow to do parsimony, distance matrix, and likelihood methods, including bootstrapping and consensus trees. Data types that can be handled include molecular sequences, gene frequencies, restriction sites and fragments, distance matrices, and discrete characters. Phylip works well with protein and nucleotide sequences Many other programs mimic the style of PHYLIP programs. (e.g. TREEPUZZLE, phyml, protml) Many other packages use PHYIP programs in their inner workings (e.g., PHYLO_WIN) PHYLIP runs under all operating systems Web interfaces are available
Programs in PHYLIP are Modular For example: SEQBOOT take one set of aligned sequences and writes out a file containing bootstrap samples. PROTDIST takes a aligned sequences (one or many sets) and calculates distance matices (one or many) FITCH (or NEIGHBOR) calculate best fitting or neighbor joining trees from one or many distance matrices CONSENSE takes many trees and returns a consensus tree …. modules are available to draw trees as well, but often people use treeview, figtree, or njplot
The Phylip Manual is an excellent source of information. Brief one line descriptions of the programs are here The easiest way to run PHYLIP programs is via a command line menu (similar to clustalw). The program is invoked through clicking on an icon, or by typing the program name at the command line. > seqboot > protpars > fitch If there is no file called infile the program responds with: [gogarten@carrot gogarten]$ seqboot seqboot: can't find input file "infile" Please enter a new file name>
menu interface example: seqboot and protpars on infile1
Sequence alignment: CLUSTALW MUSCLE Removing ambiguous positions: T-COFFEE FORBACK Generation of pseudosamples: SEQBOOT PROTDIST TREE-PUZZLE Calculating and evaluating phylogenies: PROTPARS PHYML NEIGHBOR FITCH SH-TEST in TREE-PUZZLE CONSENSE Comparing phylogenies: Comparing models: Maximum Likelihood Ratio Test Visualizing trees: ATV, njplot, or treeview Phylip programs can be combined in many different ways with one another and with programs that use the same file formats.
Elliot Sober’s Gremlins Observation: Loud noise in the attic ? Hypothesis: gremlins in the attic playing bowling Likelihood = P(noise|gremlins in the attic) P(gremlins in the attic|noise) ? ?
P(data|model, I) P(model|data, I) = P(model, I) P(data,I) Likelihood describes how well the model predicts the data Bayes’ Theorem Posterior Probability represents the degree to which we believe a given model accurately describes the situation given the available data and all of our prior information I Prior Probability describes the degree to which we believe the model accurately describes reality based on all of our prior information. Normalizing constant Reverend Thomas Bayes (1702-1761)
Li pi= L1+L2+L3 Ni pi Ntotal Alternative Approaches to Estimate Posterior Probabilities Bayesian Posterior Probability Mapping with MrBayes(Huelsenbeck and Ronquist, 2001) Problem: Strimmer’s formula only considers 3 trees (those that maximize the likelihood for the three topologies) Solution: Exploration of the tree space by sampling trees using a biased random walk (Implemented in MrBayes program) Trees with higher likelihoods will be sampled more often ,where Ni - number of sampled trees of topology i, i=1,2,3 Ntotal – total number of sampled trees (has to be large)
Illustration of a biased random walk Image generated with Paul Lewis's MCRobot Figure generated using MCRobot program (Paul Lewis, 2001)
Likelihood estimates do not take prior information into consideration: e.g., if the result of three coin tosses is 3 times head, then the likelihood estimate for the frequency of having a head is 1 (3 out of 3 events) and the estimate for the frequency of having a head is zero. The probability that both events (A and B) occur Both sides expressed as conditional probability If A is the model and B is the data, thenP(B|A) is the likelihood of model A P(A|B) is the posterior probability of the model given the data. P(A) is the considered the prior probability of the model.P(B) often is treated as a normalizing constant.
Why could a gene tree be different from the species tree? • Lack of resolution • Lineage sorting • Gene duplications/gene loss (paralogs/orthologs) • Gene transfer • Systematic artifacts (e.g., compositional bias and long branch attraction)
Trees – what might they mean? Calculating a tree is comparatively easy, figuring out what it might mean is much more difficult. If this is the probable organismal tree: species A species B species C species D what could be the reason for obtaining this gene tree: seq. from A seq. from D seq. from C seq. from B
e.g., 60% bootstrap support for bipartition (AD)(CB) lack of resolution seq. from A seq. from D seq. from C seq. from B
the two longest branches join together e.g., 100% bootstrap support for bipartition (AD)(CB) long branch attraction artifact seq. from A seq. from D seq. from C seq. from B What could you do to investigate if this is a possible explanation? use only slow positions, use an algorithm that corrects for ASRV
Gene Transfer molecular tree: seq. from A seq. from D seq. from C seq. from B speciation genetransfer Gene transfer Organismal tree: species A species B species C species D
molecular tree: seq. from A seq. from D seq. from C seq. from B Lineage Sorting Organismal tree: species A species B species C Genes diverge and coexist in the organismal lineage species D
molecular tree: molecular tree: seq. from A seq. from A seq. from A seq. from B seq. from B seq. from C seq. from C seq. from D seq. from D seq. from D seq.’ from B seq.’ from B seq.’ from B seq.’ from C seq.’ from C seq.’ from C gene duplication gene duplication gene duplication seq.’ from D seq.’ from D Gene duplication Organismal tree: species A species B species C gene duplication species D molecular tree:
Gene duplication and gene transfer are equivalent explanations. The more relatives of C are found that do not have the blue type of gene, the less likely is the duplication loss scenario Ancient duplication followed by gene loss Horizontal or lateral Gene Note that scenario B involves many more individual events than A 1 HGT with orthologous replacement 1 gene duplication followed by 4 independent gene loss events
Function, ortho- and paralogy molecular tree: seq. from A seq.’ from B seq.’fromC seq.’ from D gene duplication seq. from B seq. from C seq. from D The presence of the duplication is a taxonomic character (shared derived character in species B C D). The phylogeny suggests that seq’ and seq have similar function, and that this function was important in the evolution of the clade BCD. seq’ in B and seq’in C and D are orthologs and probably have the same function, whereas seq and seq’ in BCD probably have different function (the difference might be in subfunctionalization of functions that seq had in A. – e.g. organ specific expression)
s=.2 s=.1
10 replicates N=50 s=0
N=50 s=0 50 replicates
5 replicates N=10 s=0
5 replicates N=50 s=0
5 replicates N=100 s=0
5 replicates N=500 s=0
N=5000 s=0 5 replicates
N=50 s=0.1 5 replicates
N=500 s=0.1 5 replicates
N=50 s=0.1 5 replicates
N=50 s=0.1 5 replicates
N=50 s=0.1 5 replicates
S=0: every allele has the same chance of being the lucky ancestor.
For advantageous mutations: Probability of fixation, P, is approximately equal to 2s; e.g., if selective advantage s = 5% then P = 10% tav=2/s*log2N generations = 40*log100= 80