Plume Source Position Estimation Using Sensor Networks
Plume Source Position Estimation Using Sensor Networks. Michalis P. Michaelides & Christos G. Panayiotou Dept. of Electrical and Computer Engineering University of Cyprus E-NEXT WG1 Meeting September 29, 2005. Motivation. Motivation.

Plume Source Position Estimation Using Sensor Networks
E N D
Presentation Transcript
Plume Source Position Estimation Using Sensor Networks Michalis P. Michaelides & Christos G. Panayiotou Dept. of Electrical and Computer Engineering University of Cyprus E-NEXT WG1 Meeting September 29, 2005
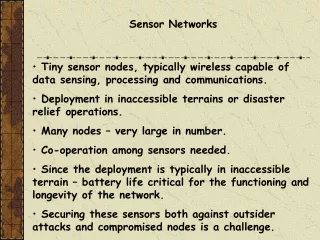
Motivation • Diversity and quantity of chemicals released into the environment has risen dramatically in recent years. • Legacy of land and groundwater contaminated by human activities affects the ecosystem, human health and quality of life. • Need for reliable, cost-effective monitoring of contaminating compounds in water, soil and sediments…
Motivation cont. • One of the most dangerous terrorist attacks is the release of toxic plumes. • Internationally this is a hot research topic following the September 11, 2001 in New York terrorist attacks. • A contaminant source can also occur as a result of an accident at a ship or factory. • In both cases people and the proper authorities need the necessary information within minutes after the event to deal with the crisis…
Presentation Overview • Introduction • Related work • Simulation model • Simulation results • Conclusion • Future Work
Plume propagation • Once released at its source odor is carried by the wind to form a plume. • As the plume travels further away it becomes on average more dilute due to molecular diffusion. • Dominant cause of diffusion is turbulence. • Characteristics of odor plume depend on physical environment.
Output of odor plume • Graphical interpretation of the output of an odor plume with moderate turbulence. • Sensor was stationary at 10 cm downstream of the odor source and at the geometric center of the plume.
Smooth Time-invariant Gaussian plume model with peak near the source. Odor concentration gradient along wind direction is negligibly small. Time averaged gradient points towards the source only close to the source. Discontinuous Time-varying Detected a lot more often than Gaussian model predicts. Instantaneous concentrations available at significant distances from source. Direction of instantaneous gradient does not always point to odor source. Time averaged vs. Instantaneous Plume
Related work in plume tracking using unmanned vehicles • Bio-mimetic robotic plume-tracing algorithms based on olfactory sensing (Homing, Foraging, Mate seeking) • Basic steps in robotic plume-tracing • Sensing the chemical and sensing or estimating fluid velocity. • Generating sequence of searcher speed and heading commands such that the motion of the vehicle is likely to locate the odor source. • J. Farrell et al. uses an autonomous vehicle operating in the fluid flow capable of detecting above threshold chemical concentration and sensing fluid flow velocity.
Plume finding: If the plume is within sensing radius of any of the sensors it is immediately discovered. (among people, around buildings, obstacles…) Plume maintaining: Contact with the plume is maintained throughout the sensor field- no reacquisition necessary. (time-averaging is possible) Assuming static sensors the position of the source needs to be remotely estimated using fusion techniques. Energy constraints Need efficient routing techniques to relay the information hop by hop to the sink. Plume finding: Has to spend a good amount of time searching for the plume in reachable areas. Plume maintaining: Has the problem of maintaining contact with the plume once found and reacquiring contact in case it is lost. Can move closer to source for better estimation until it finds source location. All necessary computation can be done on-board. Once source location is identified it returns to base to report. Vehicles vs. Sensor Networks
Related work in sensor networks • By summer 2005 Syracuse University researchers will have installed a dozen robotic sensors to form the largest underwater monitoring system in USA. • In Europe SENSPOL Thematic Network focused European expertise on the problems associated with monitoring environmental pollutants in water, soil and sediments. • Oak Ridge National Laboratory in USA are working to develop a SensorNet that will serve as a national system for comprehensive incident management that will rapidly respond to a chemical, biological or radiological event. • Los Alamos National Laboratory are working in developing a DSN (Distributed Sensor Network) that will detect a motor vehicle carrying a RDD (Radiological Dispersion Device) • CSIP (Collaborative Signal Information Processing) deals with the energy constrained dynamic sensor collaboration.
Sensor Network Plume Tracking Contaminant Source Sensor nodes
Simulation model • N sensor nodes stationary, randomly placed in a rectangular field R with locations known ( xi , yi ). • Contaminant source ( xs , ys ) is somewhere inside R (1km x 1km). • Propagation of contaminant transport is uniform in all directions. • We assume additive Gaussian white noise. • α=2, c=106 or simulation results. Measurement of sensor i at time t Concentration at source Gaussian white noise Radial distance of sensor i from the source
Least squares estimation • Sensor nodes calculate the mean of M measurements and then send the computed mean to the sink. • After the sink receives the information from all sensor nodes it employs the nonlinear least squares method to compute an estimate of the source location by minimizing function J.
Least squares start position • LS max start – start the minimization in the neighbourhood of the sensor node with the highest measurement. • LS random start – randomly pick 10 start positions in the sensor field. • LS combo – choose the method that minimizes the squared 2-norm of the residual. • CPA – Closest point approach • The source position is the location of the sensor that measured the highest concentration.
Simulation results • MATLAB simulation package • 100 randomly placed sources for each experiment (K=100) • Effect of varying number of sensors, noise variance and number of measurement samples.
Conclusions • Our proposed sensor network estimates the plume source location in a constrained sensor field assuming a uniform propagation of the plume. • The proposed Nonlinear Least Squares optimization achieves better estimation results than the CPA( Closest Point Approach ). • Our results indicate that in situations of high noise variance it is necessary to increase the number of sensors or the number of measurements to achieve satisfactory results.
Sensor Network Plume Tracking with wind Wind Direction Contaminant Source Sensor nodes
New model • Only a few of the sensors are able to detect the plume based on wind direction and spread of the plume. • When a sensor node is triggered by the presence of the plume it wakes-up, it takes a number of discrete measurements and calculates the mean. • If the mean exceeds a predefined threshold T it communicates this value to the sink and continues measuring otherwise it goes back to sleep. • At the sink as before the nonlinear least squares optimization is used to find the source position using all available measurements.
New estimator • LSp Least squares estimator with initial concentration known. • LSc Least squares estimator with initial concentration unknown. • Use separable least squares techniques • Further improvements: • LSu Unconstrained optimization • LSw Constrained search based on wind direction
Threshold considerations… • Determines the number of sensors involved in the estimation. • Needs to be large enough to minimize probability of false alarms. • Needs to be small enough to ensure maximum detection probability. • Needs to be appropriately chosen to minimize energy consumption while not compromising estimation accuracy.
Future Work • Propagation model • Gaussian model, wind, turbulence • Noise • Other models, e.g., lognormal or Chi-Square • Estimation techniques • Maximum Likelihood, Bayesian estimators • Data fusion, aggregation • Multiple sources • Real-time implementation • Berkeley modes test-bed