Source measurements at CERN
90 likes | 138 Vues
Explore the Prague method for analyzing efficiencies in detector clusters at CERN, utilizing S-curve reconstruction to identify the 50% efficiency point. Results from the first simulations show robustness and comparison with source measurements. Future plans include improving geometry in Geant4 and detailed data comparison.

Source measurements at CERN
E N D
Presentation Transcript
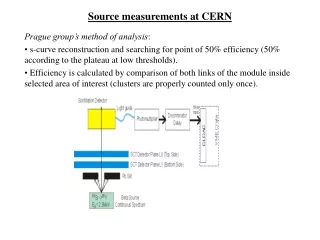
Prague group’s method of analysis: • s-curve reconstruction and searching for point of 50% efficiency (50% according to the plateau at low thresholds). • Efficiency is calculated by comparison of both links of the module inside selected area of interest (clusters are properly counted only once). Source measurements at CERN
New Source measurements at CERNPrague MethodSource and MIP: First Simulation Results Pavel Reznicek, Zdenek Dolezal, Peter Kodys Prague Bettina Mikulec, Marianne Mangin-Brinet, Mauro Donega, Monica D’Onofrio, Rainer Wallny CERN/Geneva
Output: • Efficiency -> Median points (like in a beam test) • Noise occupancy • Cluster sizes • Multiplicity • Caveat: • Efficiency not absolute • false trigger pulses • R/O inefficiency (no anchor module used) • • Some modules’ plateau at 95% only
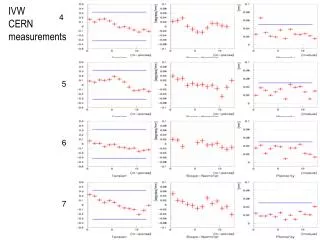
New measurements: K5-503 Irradiated, 500 V, various configurations to check the geometry sensitivity No obvious differences in median charges for different configuration (edge mode, position of the track, …) The method is quite robust
Geant4 simulation: • Detectors descriptions • Particle gun • Physics processes Simulation and digitization Input (detector and particles properties) Simulation Digitization output: Simulations output: text file with tracks and deposited energy Digitization output: s-curve, noise occupancy, cluster size, (hit-map)
First Simulation Results: MIP Original Landau distribution S-curve after digitization (charge sharing, etc.) Integral (hits)
Some observations: Link0 to Link1 ratio MIP-hits medians on both links are the same. b -hits medians: L1 20% higher Link0, b to MIP ratio MPV: 1.05 Cluster size: 1.22 : 1.02 Digits median: almost the same Link0, Digits to Hits median MIP: 0.75 b: 0.70 (larger charge sharing) First Results: MIP to Beta particles comparison b simulation: real Sr spectrum shape
Plans Better geometry in Geant4 Proper timing in SCT-digitization software Detailed comparison to testbeam and source tests data: DST production Angular scans Residuals Eta-plots More source measurements Communication/feedback to software people