Download
1 / 6
60 likes | 73 Vues
We asked 40 people over all – roughly between 6-7 people each. All from different backgrounds – Some were students – asked by the people they live with in halls Some were work colleagues ages from 18- 45. Members of the public.

E N D
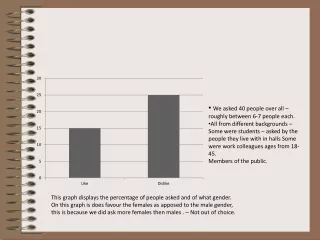
We asked 40 people over all – roughly between 6-7 people each. • All from different backgrounds – Some were students – asked by the people they live with in halls Some were work colleagues ages from 18- 45. • Members of the public. This graph displays the percentage of people asked and of what gender. On this graph is does favour the females as apposed to the male gender, this is because we did ask more females then males . – Not out of choice.
This question surprised us when looking back on questionnaire feedback. As we felt that many people told us of there dislike for him which was 25 out of 40 people – that’s just under 60%. This could be due to how he is represented in the media as the people we spoke to felt that because he had his own show – Life stories with Piers Morgan, it placed him an a higher placement of power, which in turn can lead to overexposure. A correlation was produced to identify if the sex of the participants affected their answer to this question. With a positive correlation of + 0.6, this statement was correct, with females more likely to show affection towards Piers Morgan.
For this research task , we tried to ask a range of age groups. As we are students ranging from 18-22, this was obviously our bigger audience. However we tried to reach out to older audiences to have a variety of feedback.
Shows associated with Piers Morgan. • Britain's Got Talent • American’s Got Talent • Piers Morgan Life Stories • These were the three main programs that the audience associated with Piers Morgan.Britain's got talent is watched by millions of viewers and as Piers Morgan is a judge of this television show he is best known for this show. • Surprisingly, few people responded to his former role as a newspaper editor. This suggests that the medium of Television is more mainstream than that of the newspaper, implying that his transition into a TV personality has given him more exposure.
A • Upper Middle Class • B • Middle Class • C1 • Lower Middle Class • C2 • Skilled Working Class • D • Working Class • E • Lowest Class
While doing our research we spilt the categories up so that each of us included them within our questionnaires. Each member of the group chose a category – A B C1 C2 D E and tried to target just that audience. We felt this would be a great way to get feedback from different people of different social class and ethnicity.