
Abstract
Actual. Cubic. -LN^2. Log-Log. Quad. Log Linear. SLIC. Molecular Weights. Predicted MW. Predicted MW. Predicted MW. Predicted MW. Predicted MW. Predicted MW. Fig. 3 Raw Standards. 200,000. 201,028. 197,751. 197,683. 183,306. 164,210. 144,849. 116,250. 115,949. 118,022.

Abstract
E N D
Presentation Transcript
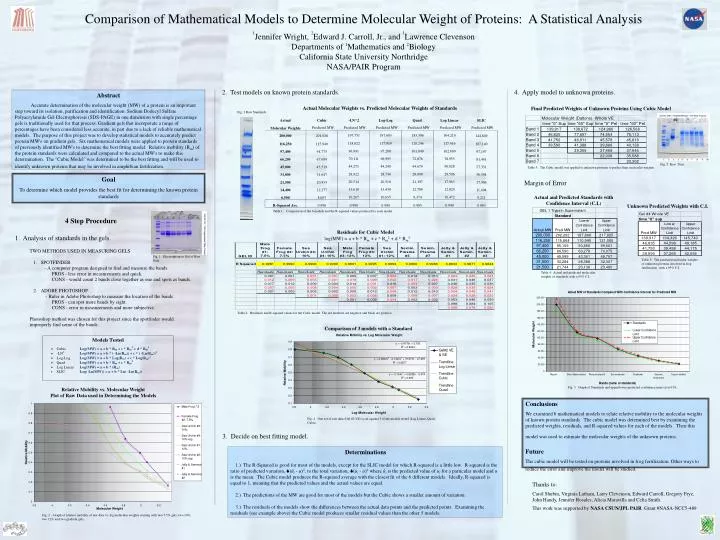
Actual Cubic -LN^2 Log-Log Quad. Log Linear SLIC Molecular Weights Predicted MW Predicted MW Predicted MW Predicted MW Predicted MW Predicted MW Fig. 3 Raw Standards 200,000 201,028 197,751 197,683 183,306 164,210 144,849 116,250 115,949 118,022 117,919 120,246 117,416 107,140 97,400 94,775 96,991 97,280 101,049 102,609 97,197 66,200 67,689 70,111 69,995 72,876 78,955 81,441 45,000 45,519 44,271 44,248 44,679 50,028 57,331 31,000 31,647 28,822 28,736 28,090 29,506 36,594 Fig. 5 Raw Data 21,500 20,933 20,514 20,518 21,197 17,963 17,906 14,400 12,277 13,618 13,438 12,789 12,820 11,494 6,500 8,007 10,267 10,635 9,374 10,472 9,211 R-Squared Ave. 0.996 0.990 0.989 0.985 0.949 0.863 Final Predicted Weights of Unknown Proteins Using Cubic Model Table 3: The Cubic model was applied to unknown proteins to predict their molecular weights. Actual and Predicted Standards with Confidence Interval (C.I.) Fig. 1 Electrophoresis Gel of Raw Data Unknown Predicted Weights with C.I. Residuals for Cubic Model log(MW) = a + b * Rm + c * Rm2 + d * Rm3 Table 5: The predicted molecular weights of unknown proteins involved in frog fertilization with a 95% C.I.. Table 4: Actual and predicted molecular weights of standards with a 95% C.I.. Table 2: Residuals and R-squared values for the Cubic model. The red numbers are negative and black are positive. Comparison of 3 models with a Standard Relative Mobility vs. Molecular Weight Plot of Raw Data used in Determining the Models Fig. 4 One set of raw data (Gel #2 VE) is set against 3 of the models tested (Log Linear, Quad., Cubic). Fig. 2 – Graph of relative mobility of raw data vs. log molecular weights starting with two 7.5% gels, two 10%, two 12% and two gradient gels. Comparison of Mathematical Models to Determine Molecular Weight of Proteins: A Statistical Analysis 1Jennifer Wright, 2Edward J. Carroll, Jr., and 1Lawrence Clevenson Departments of 1Mathematics and 2Biology California State University Northridge NASA/PAIR Program • 2. Test models on known protein standards. • 4. Apply model to unknown proteins. Abstract Accurate determination of the molecular weight (MW) of a protein is an important step toward its isolation, purification and identification. Sodium Dodecyl Sulfate Polyacrylamide Gel Electrophoresis (SDS-PAGE) in one dimension with single percentage gels is traditionally used for that process. Gradient gels that incorporate a range of percentages have been considered less accurate, in part due to a lack of reliable mathematical models. The purpose of this project was to develop statistical models to accurately predict protein MW's on gradient gels. Six mathematical models were applied to protein standards of previously identified MW's to determine the best fitting model. Relative mobility (Rm) of the protein standards were calculated and compared to the actual MW's to make this determination. The "Cubic Model" was determined to be the best fitting and will be used to identify unknown proteins that may be involved in amphibian fertilization. Actual Molecular Weights vs. Predicted Molecular Weights of Standards Goal To determine which model provides the best fit for determining the known protein standards • Margin of Error Table 1: Comparison of the 6 models and the R-squared values produced by each model. 4 Step Procedure 1. Analysis of standards in the gels. Fig. 5 Graph of Standards and upper/lower predicted confidence interval at 95%. Conclusions We examined 6 mathematical models to relate relative mobility to the molecular weights of known protein standards. The cubic model was determined best by examining the predicted weights, residuals, and R-squared values for each of the models. Then this model was used to estimate the molecular weights of the unknown proteins. Future The cubic model will be tested on proteins involved in frog fertilization. Other ways to reduce the error and improve the model will be studied. 3. Decide on best fitting model. Determinations 1.) The R-Squared is good for most of the models, except for the SLIC model for which R-squared is a little low. R-squared is the ratio of predicted variation, (ûi - u)2, to the total variation, (ui - u)2 where ûi is the predicted value of ui for a particular model and u is the mean. The Cubic model produces the R-squared average with the closest fit of the 6 different models. Ideally, R-squared is equal to 1, meaning that the predicted values and the actual values are equal. 2.) The predictions of the MW are good for most of the models but the Cubic shows a smaller amount of variation. 3.) The residuals of the models show the differences between the actual data points and the predicted points. Examining the residuals (see example above) the Cubic model produces smaller residual values than the other 5 models. Thanks to: Carol Shubin, Virginia Latham, Larry Clevenson, Edward Carroll, Gregory Frye, John Handy, Jennifer Rosales, Alicia Maravilla and Celia Smith. This work was supported by NASA CSUN/JPL PAIR. Grant #NASA-NCC5-489


