Download
1 / 24
240 likes | 361 Vues
This document presents findings from the workshop led by Jarmo Koistinen at the Taiwan GPM GV Workshop in September 2005, focusing on validating snowfall measurements in Northern Europe through radar technology. It details the FMI weather radar network, which includes eight C-band Dopplers operational since 2000. This study discusses the potential of various Finnish sites, like Sodankylä, for measurement validation, and introduces methodologies for improving snowfall data accuracy using a mix of radar and gauge observations. The insights gained are key for enhancing climate models in boreal forests.

E N D
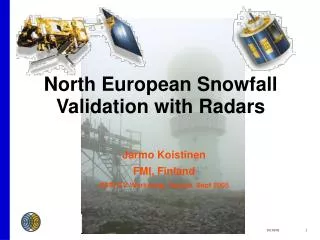
Jarmo Koistinen FMI, Finland GPM GV Workshop, Taiwan, Sept 2005 North European Snowfall Validation with Radars
Boreal forest climate: • 100-220 snow cover days/year • Snow depth in March 20-90 cm
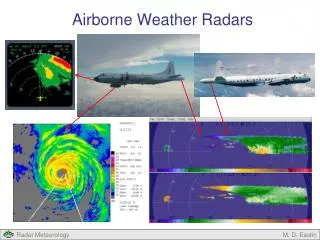
FMI weather radar network 8 C-band Dopplers Polar V, dBZ (dBT, W) archived since 2000 Data availability 99.3 % incl. maintenance and telecommunications in 2004
Potential GV site for snow Sodankylä (the northernmost radar, 67N) Global CEOP* validation site (Nr 29) *Coordinated Enhanced Observing Period (CEOP)
Helsinki Testbed (HTB), 60N, 2005-2007-?A coastal, mesoscale high latitude research and development facility (WMO/WWRP endorsement tbd). All other stations shown except Road Weather. Average WS distance 9 km (FMI regular 50 km). • IC lightning system + CG lightning system
HTB Precipitation Measurements -circles: radar 20-60km (0-250 km) -dot: manual obs -big diamond: FD12P -small diamond: potential FD12P -triangle: autom snow depth -square: weighing gauge - plan: 2 POSS to be implemented http://testbed.fmi.fi public realtime data during the campaigns (6 months during Aug 2005 – Aug 2006)
Vaisala polarimetric radar at HTB, prototype resultsRHI scans across a bright banddBZ ρHV LDR
BALTRAD composite 2005-05-28 14:15 UTC WCRP/GEWEX/BALTEXDBZC - Composites of radar reflectivity • More than 30 radars in 11 countries: BALTRAD • Radar Data Centre at SMHI, Sweden (Daniel Michelson) • Continuous operation since October 1, 1999 • Resolutions: 22 km, 15 minutes, 0.4 dBZ BALTEX Radar Data Center
RR - 3 and 12-hour Gauge-adjusted Accumulated Precipitation +Gauges-only Accumulation • 22 km horizontal resolution • Every 3 and 12 hours • 32-bit depth • Wind corrected gauge observations • 3-hour BALTRAD area • 12-hour BALTEX Region (see example)
Calibrations GPM estimates GV main tasks Radar estimates S(Ze) Major sources of error hiding here In situ estimates (SWE) gauges, POSS etc Rarely available Real snowfall at ground including density Wind correction Growth of uncertainties in the GV process of snowfall at ground
Work to improve quality(implemented) Absolute calibration is still an issue (at best 1-3 dB): • A relative calibration method based on comparing precipitation accumulation in the overlapping area of radar pairs. • Elevation angle calibration to better than 0.05 degrees (high latitude sun hits the operational scans densely during rise and set). Cold climate phenomena diagnosed applying pattern recognition and fuzzy logics (in future applying polarimetry): • Anomalous propagation common introducing strong sea and ship clutter. • Migration of birds and insects.
Better accuracy with integrated data: • Hydrometeor phase analysis (rain, sleet, snow) based on surface data (T,RH). Resolution 5 min & 1 km. • Time-space variable Z – R / Ze – S relations.Operational since 1999: Grey background: snowBlue background: rainPink background: mixed
But R(Z)-S(Ze) relations play only a minor role 3000 gauge/radar winter comparisons • Variable-phase (R or S) method in solid line • Z-R only in dashed line • Snow cases in orange, all cases in grey • Correct Z-R or Z-S is negligible compared to the increasing bias as a function of range Gauge/Radar Range
Examples of measured reflectivity profiles Snow,melting close to ground Snow
Overhanging snow (virga, Altostratus) Snow, evaporation and residual clutter 1(2)
1(2) Automatic real time classification of VPRs based on radar and NWP data (556 471 profiles) VPR. type (at ground):
Snowfall measurements require 20 dBs more sensitivity than those of rainfall Cumulative probability distribution of snowfall in 106 825 profiles MDS of GPM
Climatological profiles based on the measured 2.4 million precipitation profiles
Vertical profiles of reflectivity (VPR) in winter introduce large biases (S) in the radar estimates of surface precipitation 1(2)
Profile correction for 500 m PsCAPPI Example: A Snow Case 1(2)
Yearly average radar bias for 500 m PsCAPPI as a function of range 1(2)
Improving validation data applying a spatially continuous VPR correction Corrected to ground level Measured 24 h accumulated precipitation Nov 7, 2002, 14 UTC 1(2)
Better accuracy with integrated data – but in proper order! • Remove non-meteorological echoes and OP. • Attenuation correction. • Blocking- & VPR-correction & intelligent compositing => Precipitation at ground • Time-space variable R(Z) / S(Ze) relations. • Diagnose areas of total beam overshooting. • Gauge-radar adjustment.