Distributed Services for Microsensor Networks Sensorware 2/3/2000
Distributed Services for Microsensor Networks Sensorware 2/3/2000. Jon Agre Rockwell Science Center. Objectives for Sensorware. Improve Software Infrastructure for Sensor Nets Deterministic Realtime Embedded Environment Distributed Middleware Services

Distributed Services for Microsensor Networks Sensorware 2/3/2000
E N D
Presentation Transcript
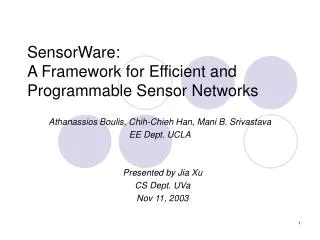
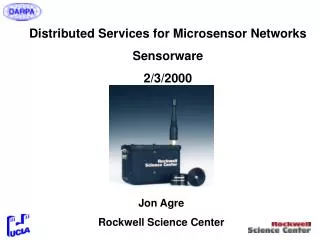
Distributed Services for Microsensor Networks • Sensorware • 2/3/2000 Jon Agre Rockwell Science Center
Objectives for Sensorware • Improve Software Infrastructure for Sensor Nets • Deterministic Realtime Embedded Environment • Distributed Middleware Services • Scalable, Deterministic, Efficient, High Performance • Mobile Script Control • Demonstration of Distributed Services Technologies • Target Tracking with Mobile Script (using middleware services)
Related Microsensor Projects - Candidate Software Functions for Middleware • DARPA AWAIRS • Multihop Routing, TDMA Protocol, Self-organization, Beamforming Algorithms • Synchronized Array Data Collection Application, Detection Network Application • ARL Sensors and Displays • Single-node Target Classification Algorithms for seismic, acoustic and magnetic, • Coordinate-based Displays, User Interaction Models, Hand-held Displays • Windows gateway (C++) • Rockwell PLGR LAN • Multiple, slowly mobile user protocol (multihop) • GPS and positioning interface • ONR Condition-based Maintenance (CBM) • Machinery diagnostics with High speed vibration, temperature, pressure • Web-based control Interface (Java) • ONR Open Systems Architecture for CBM • Causal Network Diagnostics • Corba-based interface for distributed systems
Sensor Node Signal Processing Architecture Alarms may be reported and awaken next layer Beamformation Fuse features with neighbors cooperative Query/corroborate with neighbors Increasing Quality (decreasing false alarm rate, increasing detection rate) Higher Power Expended Fuse multiple on-module sensors autonomous Process single sensor Continuous sample, HW filter, threshold compare
User Interaction with Microsensor Network: Examples • Inform sensor system to save/expend energy • no enemy activity expected; go to low alert (or vice versa: high alert) • friendlies or noncombatants entering zone; ignore • coverage by another sensor; sleep • unimportant area of operations for some duration • Adjust energy expenditure in different dimensions • adjust level of decision detail (coarse - fine), both continuous and event-based • adjust required minimum latency (including heartbeat) • adjust required system lifetime • Ask for more detail from one or a small set of select nodes • Inform network of likely targets - adjust Bayesian priors • Inform network of spatial character expected of targets • Inform network of new target type - provide new template • Provide network new signal processing software • Command network to increase covertness (LPD/LPI) • remain radio silent until T minutes after target leaves area
User Interaction with Microsensor Network (continued) • Inform network of conditions it cannot autonomously determine • from external sources; weather (hail, snow, etc.), muddy terrain, animal movements, etc. • Manually aid decisioning based on explicit knowledge or inference • deduce 2 reported targets are actually one • help resolve target type based on deduction or fusion with external sources • Inform network of impending addition of more nodes (overseeding) and when to expect it to occur • network can expend more energy in anticipation of resupply • will adjust network entry access protocol to speed process and save energy • disconnected networks can anticipate bridging (merging) Lifetime User selects performance: Rapidity of info (latency -1) Detail and/or Certainty
Situation Awareness in MOUT Exercise at Ft Benning McKenna MOUT Facility
GPS Receiver Local Area Network (PLGR-LAN) • Low cost situational awareness and messaging tool for the warfighter. • Allows for localized C2 for the squad or platoon in an urban environment • Can also be used with distributed sensors to provide additional intelligence gathering and alerting capabilities. Rockwell Collins
Condition-based MaintenanceFailure Prediction for Individual Units and Complex Systems • Condition-based Maintenance/Failure Prediction • Motor Failure Prediction • Process Monitoring • High Value / Critical Asset Monitoring • Systems Monitoring • CBM / FP Provides for: • Substantial Maintenance, Logistics and Unscheduled Down-time Cost Savings • Manpower Reduction • Increased Safety
Internet-based Demonstration of WINS for CBMWINS Nodes In Chilled Water Pump Room Ten wireless nodes transmit temperature and vibration information to the basestation node -> internet server http://wins.rsc.rockwell.com Web Server Basestation Node
Internet-based Demonstration of WINS for CBM WINS Network - Main Screen Java Applet running on WINS webpage. http://wins.rsc.rockwell.com Sensor Node Icons present summary color-coded bar graphs of bearing health indicators for quick problem identification. Gray colored icons are motors that are presently turned off.
Poll sensor nodes for another test result Adjustable scale settings Double clicking on icon brings up Bearing Diagnostics Detail Screen Bearing Diagnostics Report Baseline Reading Largest Reading Ball Pass Frequency, Inner Race Fault frequency and 19 harmonics
ONR OSA-CBM Overall Program Goals • Develop an integrated, condition based monitoring (CBM) system • define the software infrastructure (or middleware) • define groups of software interfaces for each OSA-CBM layer • use existing standards if available • define non-existing standards • Demonstrate OSA-CBM capability • demonstrate capability and usability of developed standards on different diagnostic platforms (RSC Nodes)
XML XML XML XML XML XML XML OSA/CBM (PROPOSED) MIMOSA OPC STEP Presentation layer is the man/machine interface. May query all other layers. PRESENTATION HTML XSL Decision support utilizes spares, logistics, manning etc. to assemble maintenance options. DECISION SUPPORT Prognostics considers health assessment, employment schedule, and models/ reasoners that are able to predict future health with certainty levels and error bounds. PROGNOSTICS NETWORK HEALTH ASSESSMENT The lowest layer of embedded human intelligence Health Assessment is the lowest level of goal directed behavior. Uses historical and CM values to determine current health. Multi-site condition monitor inputs. OSA/CBM XML Schema CONDITION MONITORThe highest layer of machine data CM gathers SP data and compares to specific predefined features. Highest physical site specific application. SIGNAL PROCESSING Signal Processing provides low-level computation on sensor data. Data Acquisition- conversion/ formatting of analog output from transducer to digital word. May incorporate meta-data. Ala. 1451.X DATA ACQUISITION 1451.X SENSOR MODULE The Vertical Arrows indicate Process (Logic) flow, the Red Arrows indicate Network (connection) flow. TRANSDUCER Transducer converts some stimuli to electrical signal for entry into system.
Sensorware Progress • Task 1:Requirements Definition • SensorWare Operating System selected after evaluation • MicroC/OS - C-based, open source, lightweight, realtime OS, modifiable • Base middleware capabilities being defined in conjunction with SenseIT • Several specialized sensor network services defined • System Coverage • Signal Processing Architecture Stack (from AWAIRS) • Synchronized Sampling • Spatial-based Communication • Implementation of middleware will be in both Windows CE and MicroC/OS • Task 2:Low Level APIs • Draft version of C-based API document • Architecture improvements - (e.g., interrupt handling, radio interface) - Coding in progress • API Implementation - Coding initiated • Reference Applications (Dlog, Detection Net) - Coding in progress • System and software provided to UCLA • Port of Gateway DLL to Windows CE - Nearly complete • Emulation of PlatformConnect Windows CE to allow execution of SenseIT - Coding • Sensor.com API will be supported as feasible
Sensorware Progress (cont) • Task 3:Middleware Services • Mobile Scripting implementation - (UCLA) • New Coverage determination algorithm under investigation • Task 4:Sensor Node Improvements • New Processor Board • Increased SRAM (1 Mb) and Flash (2 Mb) • Parallel Bus Interface • Two RS-232, USB, Watchdog • New Sensor Modules • Acoustic • Accelerometer • New Package Design • Rechargeable batteries • Solar power • Task 5:Demonstration and Integration • Target tracking with mobile scripts demonstration on track • Joint demonstration of capabilites planned with DSN Project (ISI, VaTech, UCLA)
Improved Sensor Package Solar Cell GPS* Acoustic Geo Radio Magnetic Processor Seismic Power Supply Batteries *Design Only Power Supply (TOP) Parallel Interface Sensor Side Processor (Bottom) Processor (Top) Serial Interface
Middleware Services • Base Services (Defined in Conjunction with SenseIT) • Communications Protocol Stacks • Signal Processing Stack • Power Management • User Interaction • Network Synchronization • Query Processing • Configuration (Bootup, health status, maintenance) • Fault Tolerance • Security/Authentication • Specialized Services • Mobile Script • System Coverage (Sensing) • Synchronized Sampling • Spatial-based Communication
What is Middleware? • Middleware Working Definition: A software function(task) that satisfies: • At least two applications use the function, or • the applications need to run on at least two different type platforms • Middleware has two primary functions • Stitch together low-level APIs (Platform Dependent) to implement service transparently to application • Provide distributed resource management/allocation (Field Organization) • e.g., More global knowledge is necessary • Network-wide power management • Computation performance optimization
Middleware Example Need to Synchronize Samples of A and B and Send to C for Processing Application SampleSynch(A,B): RouteData(A,C): RouteData(B,C): Middleware SendMsg(A,synch(B)) SendMsg(B,synch(A)) SendMsg(A, RouteData(C)) SendMsg(B,RouteData(C)) Low Level APIs (at Source) SendMsg(M2, synch (A,B)) SendMsg(M2, ReturnData((A,B),C) M2:SendMsg(A,B, synch) M2:SendMsg(A,B ReturnData) M2:SendMsg(A,B,Sample) ... A:SendMsg(M1, Data) B:SendMsg(M1, Data) M2:Msg(M1,RouteData(C)) A:SendMsg(B, synch) A:SendMsg(B, ReturnData(C) A:SendMsg(B, Sample)... A:SendMsg(i, Data(C)) B:SendMsg(i, Data(C)) Low Level APIs (at Node Participants) A D D A M2 Physical Layer M1 Master Cluster B Peer-to-peer C B C
Coverage Service • Sensor Coverage Performance Characterization • Boundaries (perimeters) • Density • Susceptibility to Breach • Scalability • Bounded answer: quantization/compression • Bounded Messaging Throughout Process of Determining Answer • Spatially bounded query/response • Algorithm • Distributed, incremental computation • Guaranteed termination • Efficient communications network support • Instantiation • Global characterization executed at bootup • User-activated query • Generalization • Viewpoint-dependent resolution; distributed database updates (Assume that each sensor node knows its position.)
Coverage Performance Characterization • Coverage Boundaries • Given sensor detection range R, find the curve(s) that enclose the area covered by the sensors. • Generally there may be many curves due to “holes”; concern for scalability. • Density of Sensor Field • Define in terms of distances associated with Voronoi vertices. • Susceptibility to Breach • A breach will be attempted between a given origin and destination. If the path having the least likely detection is taken (a geodesic), what is the detection probability? • Optimal path will occur along Voronoi edges. • Generalization: Origin/destination selected from point set (e.g., line segment or region) Sensor node site Approximate coverage boundary Breach origin Breach destination Radius of Delaunay circle characterizes Voronoi vertex
Conclusion • All Tasks on track or ahead of schedule • Team in place and working with prototype sensor nodes and user interface software • Several new subtasks incorporated to insure integration with other SensIT projects • Joint demonstrations with DSN team (ISI, VaTech, UCLA) planned for August FY00, FY01 and FY02 • Target Tracking with Mobile Scripts planned for August Demonstration