Download
1 / 37
480 likes | 1.17k Vues
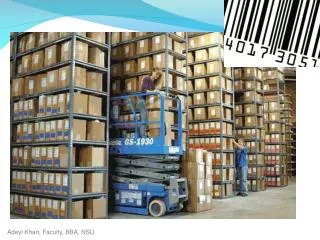
Operations Management Inventory Management Chapter 12. What is Inventory?. Stock of materials Stored capacity. © 1995 Corel Corp. © 1984-1994 T/Maker Co. © 1984-1994 T/Maker Co. © 1995 Corel Corp. Types of Inventory. Raw material Work-in-progress

E N D
Operations ManagementInventory ManagementChapter 12 © 2004 by Prentice Hall, Inc., Upper Saddle River, N.J. 07458
What is Inventory? • Stock of materials • Stored capacity © 1995 Corel Corp. © 1984-1994 T/Maker Co. © 1984-1994 T/Maker Co. © 1995 Corel Corp. © 2004 by Prentice Hall, Inc., Upper Saddle River, N.J. 07458
Types of Inventory • Raw material • Work-in-progress • Maintenance / repair / operating supplies • Finished goods © 2004 by Prentice Hall, Inc., Upper Saddle River, N.J. 07458
The Material Flow Cycle © 2004 by Prentice Hall, Inc., Upper Saddle River, N.J. 07458
The Functions of Inventory • To ”decouple” or separate various parts of the production process • To provide a stock of goods that will provide a selection for customers • To take advantage of quantity discounts • To hedge against inflation and upward price changes © 2004 by Prentice Hall, Inc., Upper Saddle River, N.J. 07458
Disadvantages of Inventory • Higher costs • Interest or opportunity costs • Holding (or carrying) costs – storage, handling, taxes, insurance, shrinkage • Ordering (or setup) costs • Risk of deterioration or obsolescence • Hides production problems • Yield / scrap variations • Unscheduled downtime Total cost = 20% - 40% of inventory value / year © 2004 by Prentice Hall, Inc., Upper Saddle River, N.J. 07458
Pressures on inventory • Pressure for lower inventory • Inventory investment • Inventory holding cost • Pressure for higher inventory • Customer service • Other costs related to inventory © 2004 by Prentice Hall, Inc., Upper Saddle River, N.J. 07458
Process stageRaw MaterialWork in ProcessFinished Goods OtherMaintenance / RepairOperating Supplies Demand TypeIndependentDependent Annual $ VolumeABC Types of InventoryCyclePipelineSafety StockAnticipation Different Views of Inventory © 2004 by Prentice Hall, Inc., Upper Saddle River, N.J. 07458
Q + 0 2 Average cycle inventory = Types of InventoryCyclePipelineSafety StockAnticipation Pipeline inventory = DL = dL How Is Inventory Created? • Cycle Inventory – result of lot size • Pipeline Inventory – in transit • Safety Stock • Anticipation Inventory © 2004 by Prentice Hall, Inc., Upper Saddle River, N.J. 07458
Inventory Worksheets Inventory Calculations We use 70 hypodermic needles a week. We buy them in lots of 280. It takes three weeks for order handling and shipment. Cycle inventory = Q/2 = 280/2 = 140 needles Pipeline inventory = DL = dL = (70 needles/week)(3 weeks) = 210 drills © 2004 by Prentice Hall, Inc., Upper Saddle River, N.J. 07458
Inventory Reduction Tactics Reduce lot size • Cycle inventory • Pipeline inventory • Safety Stock • Anticipation inventory Reduce lead time Reduce uncertainties Various © 2004 by Prentice Hall, Inc., Upper Saddle River, N.J. 07458
Annual $ VolumeABC ABC Analysis • Divides on-hand inventory into three classes on the basis of annual dollar volume – A, B, and C • $ volume = Annual demand x Unit cost • Policies based on ABC analysis • Develop class A suppliers more • Maintain tighter physical control of A items • Forecast A items more carefully © 2004 by Prentice Hall, Inc., Upper Saddle River, N.J. 07458
Class % $ Vol % Items % Annual $ Usage A 80 20 100 B 15 30 80 C 5 50 60 A 40 B C 20 0 0 50 100 % of Inventory Items ABC Analysis © 2004 by Prentice Hall, Inc., Upper Saddle River, N.J. 07458
Inventory Models forIndependent Demand • Fixed order-quantity models • Economic order quantity • Production order quantity • Quantity discount • Probabilistic models • Fixed order-period models Help answer the inventory planning questions! © 1984-1994 T/Maker Co. © 2004 by Prentice Hall, Inc., Upper Saddle River, N.J. 07458
EOQ – Economic Order Quantity • Objective: minimize (ordering cost + holding cost) • Assumptions: • Known and constant demand • Known and constant lead time • Instantaneous receipt of material • No quantity discounts • Only ordering / setup cost and holding cost • No stockouts © 2004 by Prentice Hall, Inc., Upper Saddle River, N.J. 07458
Usage Rate Q Average CycleInventory Inventory Level Q2 0 Time Inventory Usage Over Time © 2004 by Prentice Hall, Inc., Upper Saddle River, N.J. 07458
Annual Cost Total Cost Holding Cost Minimum total cost Ordering (Setup) Cost Order quantity (Q) Optimal Order Quantity (Q*) EOQ ModelHow Much to Order? © 2004 by Prentice Hall, Inc., Upper Saddle River, N.J. 07458
Purchase Order Purchase Order Description Qty. Description Qty. Microwave 1 Microwave 1000 Order quantity Why Holding Costs Increase More units must be stored if more are ordered © 2004 by Prentice Hall, Inc., Upper Saddle River, N.J. 07458
1 Order (Postage $ 0.33) 1000 Orders (Postage $330) Purchase Order PurchaseOrder Purchase Order Purchase Order Description Qty. Purchase Order Description Qty. Description Qty. Description Qty. Microwave 1 Description Qty. Microwave 1000 Microwave 1 Microwave 1 Microwave 1 Order quantity Why Ordering Costs Decrease Cost is spread over more unitsExample: You need 1000 microwave ovens © 2004 by Prentice Hall, Inc., Upper Saddle River, N.J. 07458
Inventory Level Q* Average CycleInventory Reorder Point (ROP) Time Lead Time EOQ Model – When to Order © 2004 by Prentice Hall, Inc., Upper Saddle River, N.J. 07458
× × 2 D S Optimal Order Quantity = = Q* H D = Expected Number of Orders = N Q* Working Days / Year Expected Time Between Orders = = T N D D = Demand per year S = Setup (order) cost per order H = Holding (carrying) cost d = Demand per day L = Lead time in days = d Working Days / Year = × ROP d L EOQ Model Equations © 2004 by Prentice Hall, Inc., Upper Saddle River, N.J. 07458
Inventory Models forIndependent Demand • Fixed order-quantity models • Economic order quantity • Production order quantity • Quantity discount • Probabilistic models • Fixed order-period models Help answer the inventory planning questions! © 1984-1994 T/Maker Co. © 2004 by Prentice Hall, Inc., Upper Saddle River, N.J. 07458
POQ – Production Order Quantity • Answers how much to order and when to order • Allows partial receipt of material • Other EOQ assumptions apply • Suited for production environment • Material produced, used immediately • Provides production lot size • Lower holding cost than EOQ model © 2004 by Prentice Hall, Inc., Upper Saddle River, N.J. 07458
EOQ POQ Model Both production and usage take place Usage only takes place Maximum inventory level Inventory Level Time © 2004 by Prentice Hall, Inc., Upper Saddle River, N.J. 07458
Inventory Models forIndependent Demand • Fixed order-quantity models • Economic order quantity • Production order quantity • Quantity discount • Probabilistic models • Fixed order-period models Help answer the inventory planning questions! © 1984-1994 T/Maker Co. © 2004 by Prentice Hall, Inc., Upper Saddle River, N.J. 07458
Quantity Discount Model • Answers how much to order & when to order • Allows quantity discounts • Other EOQ assumptions apply • Trade-off is between lower price & increased holding cost © 2004 by Prentice Hall, Inc., Upper Saddle River, N.J. 07458
Quantity Discount – How Much to Order © 2004 by Prentice Hall, Inc., Upper Saddle River, N.J. 07458
Inventory Models forIndependent Demand • Fixed order-quantity models • Economic order quantity • Production order quantity • Quantity discount • Probabilistic models • Fixed order-period models Help answer the inventory planning questions! © 1984-1994 T/Maker Co. © 2004 by Prentice Hall, Inc., Upper Saddle River, N.J. 07458
Service Level P(Stockout) Frequency X Probabilistic Models • Answer how much & when to order • Allow demand to vary • Other EOQ assumptions apply • Consider service level & safety stock • Service level = 1 – Probability of stockout • Higher service level means more safety stock • More safety stock means higher ROP © 2004 by Prentice Hall, Inc., Upper Saddle River, N.J. 07458
Service Level P(Stockout) Frequency Inventory Level X SS ROP Reorder Point (ROP) Safety Stock (SS) Lead Time Time Place order Receive order Probabilistic Models - When to Order? © 2004 by Prentice Hall, Inc., Upper Saddle River, N.J. 07458
Inventory Models forIndependent Demand • Fixed order-quantity models • Economic order quantity • Production order quantity • Quantity discount • Probabilistic models • Fixed order-period models Help answer the inventory planning questions! © 1984-1994 T/Maker Co. © 2004 by Prentice Hall, Inc., Upper Saddle River, N.J. 07458
Fixed Period (P) Systems • Answers how much to order • Orders placed at fixed intervals • Inventory brought up to target amount • Amount ordered varies • No continuous inventory count • Possibility of stockout between intervals • Useful when vendors visit routinely • Example: Office Max representative calls every week © 2004 by Prentice Hall, Inc., Upper Saddle River, N.J. 07458
Target maximum Q4 Q1 Q2 Q3 On-Hand Inventory p p p Time Inventory in a Fixed Period System Various amounts (Qi) are ordered at regular time intervals (p) based on the quantity necessary to bring inventory up to target maximum © 2004 by Prentice Hall, Inc., Upper Saddle River, N.J. 07458
Comparison of Q and P Systems • Continuous Review System (Q)A system designed to track the remaining inventory of an item each time a withdrawal is made, to determine whether it is time to replenish • Periodic Review System (P) A system in which an item’s inventory position is reviewed periodically rather than continuously © 2004 by Prentice Hall, Inc., Upper Saddle River, N.J. 07458
Comparison of Q and P Systems • Continuous Review System (Q) • Individual review frequencies • Possible quantity discounts • Lower, less-expensive safety stocks • Periodic Review System (P) • Convenient to administer • Orders may be combined • Inventory position only required at review © 2004 by Prentice Hall, Inc., Upper Saddle River, N.J. 07458
Average inventory value Weekly sales (at cost) $2 million ($10 million)/(52 weeks) Weeks of supply = = = 10.4 weeks $10 million $2 million Inventory Measures Average inventory = $2 million Cost of goods sold = $10 million 52 business weeks per year Annual sales (at cost) Average inventory value Inventory turns = = = 5 turns/year © 2004 by Prentice Hall, Inc., Upper Saddle River, N.J. 07458
Summary • Functions of inventory – Inventory enables value creation for many processes • Costs of inventory • Different views of inventory • Inventory reduction tactics • ABC and EOQ are traditional tools used to manage inventory – still used in many circumstances • Continuous review system (Q) for high-value parts; Periodic review system (P) for some low value parts • Weeks of Supply and inventory turns are widely-used measures of inventory © 2004 by Prentice Hall, Inc., Upper Saddle River, N.J. 07458