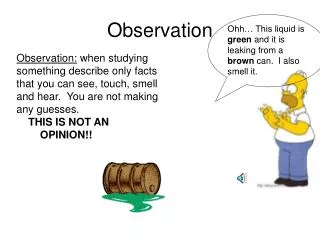
Observation
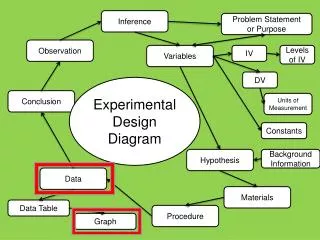
Inference. Problem Statement or Purpose. Observation. Variables. IV. Levels of IV. DV. Experimental Design Diagram. Conclusion. Units of Measurement. Constants. Hypothesis. Background Information. Data. Materials. Data Table. Procedure. Graph. S cale.

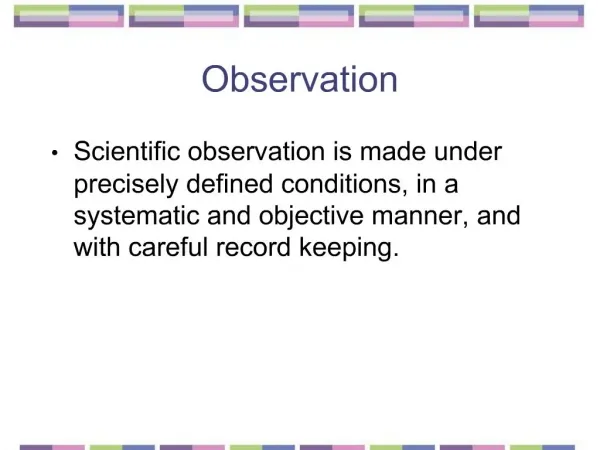
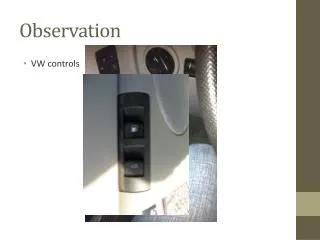
Observation
E N D
Presentation Transcript
Inference Problem Statement or Purpose Observation Variables IV Levels of IV DV Experimental Design Diagram Conclusion Units of Measurement Constants Hypothesis Background Information Data Materials Data Table Procedure Graph
Scale • -increments(what you count by) on y-axis are the same all the way across • -increments on the x-axis are the same all the way across • -increments are appropriate • Origin is at 0,0 • break graph if data is close together but far from 0 How to Be STUPYX (how to make a good graph of your data)
Title The Effect of (IV) on (DV) Units of Measurement labeled on any axis that has numbers Units is the right type of graph (bar, line, etc.) has all of the data on it is easy to read Plot y-axis - is labeled with the DV x-axis - is labeled with the IV Summary Statement: A good data graph…
The Effect of Height of Person on Number of Free Throws Made
Data Table: The Effect of Amount of Chemical on Time to Lose Extra Antennae (IV) (DV)