Download
1 / 41
410 likes | 700 Vues
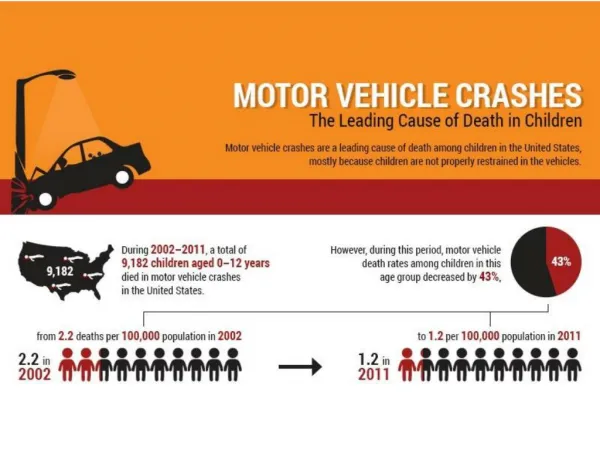
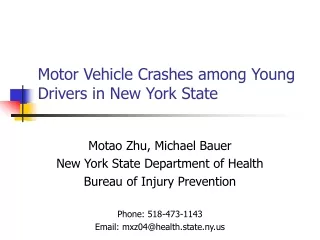
Teen Driving and Motor Vehicle Crashes. Crash Statistics. 2006 – Over 43,000 Killed In Crashes Nationwide 2006 – Over 770 Killed In Crashes In NJ 2006 – Over 300,000 Crashes Reported In NJ. Cause of Death Age 16-20 NHTSA 2003. #1 - MV Traffic Crashes (5,988) #2 – Homicide (2,489)

E N D
Crash Statistics • 2006 – Over 43,000 Killed In Crashes Nationwide • 2006 – Over 770 Killed In Crashes In NJ • 2006 – Over 300,000 Crashes Reported In NJ
Cause of Death Age 16-20NHTSA 2003 • #1 - MV Traffic Crashes (5,988) • #2 – Homicide (2,489) • #3 – Suicide (1,813) • #4 - Accidental Poisoning (752) • #5 – Cancer (749)
MV Crashes #1 Cause of Death for Youths 16-20 • Approx 1/3 Of All Deaths In This Age Group. • More Than #2 - #5 Combined • Why? • Inexperience • Easily Distracted • Driver Inattention #1 Cause Of Fatal Collisions In NJ
The Three E’s • Engineering • Enforcement • Education
Avoiding Crashes • We Must Know Our Limitations • Human Limitations • Vehicle Limitations
Human Limitations • Physical Limitations • Mental Limitations
Three CollisionsHuman Limitations • Vehicle Collision • Initial Crash • Human Collision • Body Into Interior Of Vehicle • Internal Collision • Internal Injuries/Lacerations • Transection of Aorta • Brain Injuries
Three CollisionsHuman Limitations • Speed Kills? • Sudden Stop • Tremendous Forces • Multiply Weight By Speed • Delta V (Velocity Change) • Occupant Restraints Increase Time During Delta V
Reducing Forces of the Human Collision • Occupant Restraints • Seat Belts • Air Bags
Occupant RestraintsReducing The Effect Of The Human Collision • Decrease Injury By Increasing Delta V Time • Hold Occupants In Place During Collision • Unrestrained Occupants Act As Human Bullets
Occupant RestraintsReducing The Effect Of The Human Collision • Lap Belt • Hold Occupant In Position • Shoulder Harness • Stops Jack Knife Effect • Air Bag • Prevents Head Strikes
Perception And ReactionHuman Limitations • What Is It? • Time Needed To Perceive And React • No Instant Reactions • How Long? • 1.5 Seconds Average • Daytime • Experienced Drivers
Visual AcuityHuman Limitations • Eye Function • Rods Vs Cones • Rods • Are More Sensitive • Not Sensitive To Color • Cones • Sensitive to Color • Fovea Centralis (All Cones)
Conspicuity At Night • Reduced Lighting • Shades Of Grey • Over Driving Headlights • Pedestrian Visibility
Vehicle Limitations • Traction • Braking • Lateral Acceleration (Cornering)
Vehicle Handling • Friction And Handling • Friction Circle • Straight Roads • Curves • Inertial Forces • Critical Curve Speed
Limitations • Human • Vehicle (Mechanical) • Driving Is A Learned Behavior • New Drivers Need More Time To React • More Time • Increased Following Distances • Reduced Speeds
Perception And ReactionHuman Limitations • What Is It? • Time Needed To Perceive And React • No Instant Reactions • How Long? • 1.5 Seconds Average • Daytime • Experienced Drivers
Perception And Reaction • More Time Needed For: • Night • Inexperienced Drivers • Adverse Weather • Following Distance • 2 Seconds • More For New Drivers
Speed Issues • Speed Is A Contributing Factor In Most Serious And Fatal Crashes • Speed Increases Stopping Distance • Perception/Reaction • Braking • Speed Decreases Percep/React Time • Speed + Reduced Visibility = Bad • Night, Rain, Snow, Fog
Speed Issues • How Fast Are We Really Going • MPH or FPS • MPH * 1.466 = FPS
Speed Issues • MPH vs. FPS • 25mph = 36.65fps • 35mph = 51.31fps • 45mph = 65.97fps • 55mph = 80.63fps • 65mph = 95.29fps • 75mph = 109.95fps
Speed Issues • Perception/Reaction Distance • Speed * 1.466 * 1.5 sec • 25mph – 54.9 Feet • 35mph – 76.9 Feet • 45mph – 98.9 Feet • 55mph – 120.9 Feet • 65mph – 142.9 Feet • 75mph – 164.9 Feet
Speed Issues • Braking Distance • Dependent on Speed and Surface Friction • Lower Friction Increases Braking Distance • Dry Roads Have Highest Friction
Speed Issues • Roadway Friction Values (Approx) • Dry Pavement f=0.6 to 0.8 • Wet Pavement f=0.45 to 0.65 • Snow Covered f=0.3 to 0.55 • Ice Covered f=0.05 to 0.2
Speed Issues • Braking Distance Formula
Speed Issues • Dry Pavement Braking (f=0.7) • 25mph – 29.7 Feet • 35mph – 58.3 Feet • 45mph – 96.4 Feet • 55mph – 144 Feet • 65mph – 201.1 Feet • 75mph – 267.8 Feet
Speed Issues Dry Pavement Braking (f=0.7)
Speed Issues • Slide to Stop • Different Surfaces at 45mph • Dry - 96.4 Feet (f=0.7) • Wet – 122.7 Feet (f=0.55) • Snow – 168.7 Feet (f=0.4) • Ice – 337.5 Feet (f=0.2)
Total Stopping Distance • Combine • Perception/Reaction Distance • Braking Distance
Stopping DistanceDry Pavement • Percep/React + Braking=Total Stop D • 25mph – 84.6 Feet • 35mph – 135.2 Feet • 45mph - 195.3 Feet • 55mph – 264.9 Feet • 65mph – 344 Feet • 75mph – 432.7 Feet
Big Brother Is Watching • Crash Reconstruction • Calculating Speed From: • Tire Marks • Crush Damage • Momentum Analysis • Computer Modeling • Air Bag Module • Car Chip
Legal Consequences • Tickets • Suspension • Increased Insurance Costs • Criminal Consequences • Accident While Suspended • Vehicular Assault • Vehicular Homicide