Download
1 / 38
380 likes | 406 Vues
This article explores the threats, challenges, and opportunities of the Wildland Urban Interface (WUI) where human development meets undeveloped wildland vegetation. It discusses the impact of demographic changes and trends on WUI fire management. The article also highlights the growth of WUI areas and the social implications of this growth, including the need for better coexistence with fire and increased infrastructure capacity. It concludes with an analysis of future social trends and the potential growth of the WUI.

E N D
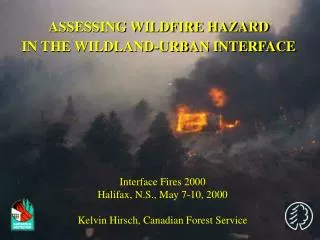
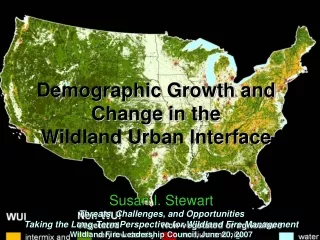
Demographic Growth and Change in the Wildland Urban Interface Susan I. Stewart Threats, Challenges, and Opportunities Taking the Long-Term Perspective for Wildland Fire Management Wildland Fire Leadership Council, June 20, 2007
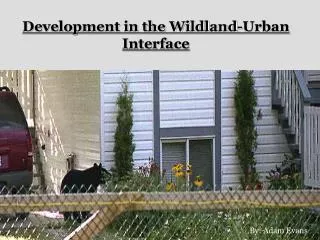
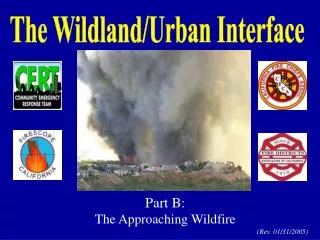
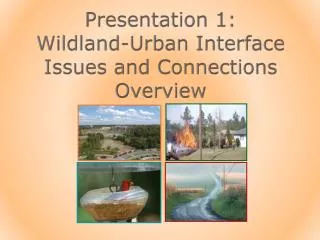
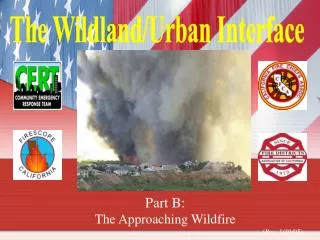
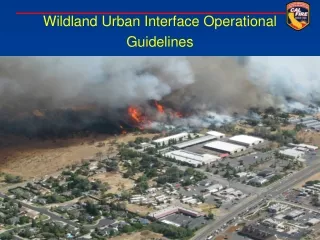
The Wildland Urban Interface • Where structures and other human development meet or intermingle with undeveloped wildland vegetation... Federal Register …and where demographic changes and trends impact wildland fire management
Port Charlotte, FL Missouri Ozarks Ruidoso, NM Oakland Hills, CA Northern Minnesota Bend, OR
The 2000 WUI Intermix and Interface Of the total WUI area 82% is intermix 18% is interface Of the houses in the WUI 49% are in the intermix 51% are in the interface
WUI homes near fire perimeters Within 4 miles of 2006 Western fire perimeters, over 90% of housing units classified as WUI, or very low density vegetated (Potential WUI)
Population in WUI, 2000 104 million people 37% of the population
WUI Growth in the 1990s:Where are the 13.6 million new homes? • 1990 and 2000 Census block boundaries reconciled. • 1992/3 NLCD land cover data used for both periods.
WUI Growth, 1990-2000 60% of new homes are in the WUI Intermix WUI is growing the fastest Growth rate 4.6 times higher than in the non-WUI
Extent of WUI area increased in a majority (83%) of counties
Social Implications: WUI Area Increase • New neighborhoods can be designed so residents can better coexist with fire • New subdivisions attract buyers from other areas • residents who are “new” to the WUI and fire • social networks not yet developed • familiarity with landscape may be low
Social Implications: WUI Density Increase • New homeowners added to neighborhoods with existing programs, social capital • New homes in existing neighborhoods are efficient to protect • Infrastructure loads increase and capacity may be reached or surpassed (water, roads) • Rising property values encourage re-investment in homes and property • possibility of underinsurance increases
Future Social Trends • Continued housing growth
What Drives Housing Growth? • Population growth • Affluence • Land use planning and policy
Expected Trends • Decentralization, including wider range of racial, ethnic groups • Stable 1990s trend • Job location decentralization will continue • Metro areas and their peripheries will grow, with variations by region
Three Americas • State-by-state analysis highlighting groups of states with similarities: • New Sunbelt: suburban-type growth, both Black and White families, domestic migration • Melting pot states: urban-like growth, immigrants, high birth rates • Heartland: other states, high growth not expected.
Suburban Urban Rural William H. Frey’s “Three Americas” William H. Frey, 2002. Three Americas: The rising significance of regions. Am. Plann. Assoc. Journal 68(4):349-357.
Non-metro Growth • Growth expected in areas with… • Proximity to growing metro • Resource amenities • Baby boomer retirement migration will be significant • From 2010, 3% growth/yr among 65+ • Amenity “bust” when Baby Bust comes of age and Boomers require more health care, family support
Growth and Protected Areas • Near urban: heavy day use, high pressure on edges, complex and diverse mix of neighbors • A day’s drive away: Recreation and retirement homes near and within; rural amenity-led growth with strong tourism and service sectors • Remote: unclear, varied patterns.
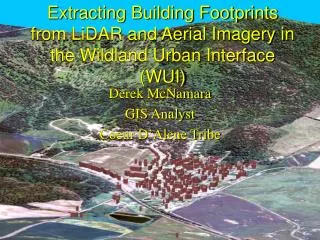
WUI and LANDFIRE data sets are complementary and should be integrated to create a comprehensive national strategic map
Wildland Urban InterfaceProject Team Roger B. Hammer Oregon State University Todd J. Hawbaker, Volker C. Radeloff, Alexandra D. Syphard, and Shelley Schmidt SILVIS Lab, University of Wisconsin-Madison Susan I. Stewart NRS, Forest Service Research We appreciate the support of: USDA Forest Service Northern Research Station, Pacific Northwest Research Station, Northern Global Change Research Program, National Fire Plan, and the University of Wisconsin-Madison