Download
1 / 42
420 likes | 444 Vues
KamLAND Experiment Reactor Antineutrino Oscillation Study 3. Geological Antineutrino Detection 4. Conclusions. Antineutrino Physics in KamLAND. Atsuto Suzuki. High Energy Accelerator Research Organization (KEK). JINR Scientific Council, January 19, 2007. 1 st generation Kamiokande :

E N D
KamLAND Experiment • Reactor Antineutrino Oscillation Study • 3. Geological Antineutrino Detection • 4. Conclusions Antineutrino Physics in KamLAND Atsuto Suzuki High Energy Accelerator Research Organization (KEK) JINR Scientific Council, January 19, 2007
1st generation Kamiokande : 3000 ton Water Cerenkov Detector (1983 - 1997) KamLAND: 3rd Generation Experiment at Kamioka 2nd generation Super-Kamiokande : 50,000 ton Water Cerenkov Detector (1996 ~ ) 3rd generation KamLAND : 1000 ton Liquid Scintillator Detector History 1994: proposal 1997: Budget was approved. Construction started. 1999: Japan-US collaboration 2002: Data-taking started.
: filled with a mixture of paraffin oil and dodecane (Dr = 0.04%) detector location: old Kamiokande site : 2700 m.w.e. 1000 ton liquid scintillator : 80% (dodecane) + 20% (pseudocumene) + 1.52 g/l PPO : housed in spherical plastic balloon water Cerenkov outer detector 3000 m3 stainless steel vessel 13 m 1325x17-inch + 554x20-inch PMT’s 18 m KamLAND Detector photocathode coverage : 34% energy resolution : 6.2 %/(E:MeV)1/2
180 km 1. KamLAND Experiment Kamioka Liquid scintillator AntiNeutrino Detector 1000 ton liquid scintillator detector 300 7Be, CNO+pep
KamLAND Data Samples for Outcomes physics run calibration run test/bad run 1st reactor result : Evidence for Reactor Antineutrino Disappearance 2nd reactor result : Evidence of Spectral Distortion 1st geoneutrino result : Experimental Investigation of Geologically Produced Antineutrinos Mar. 4 – Oct. 6, 2002 (live time = 145.4 days) Mar.9, 2002 – Jan. 11, 2004 (live time = 515.1 days) Mar.9, 2002 – Oct. 30, 2004 (live time = 749.1 days) 2002 2003 2004
Nuclear Power-Stations around Kamioka huge power nearly equal distance long baseline (180 km) ⇩ Kamioka : suitable location for neutrino oscillation study Kashiwazaki : world biggest power station (24.3 GW) Kamioka commercial reactors : 53 nominal power output : 152 GW in Japan 70 GW (~7 % of world total power generation) at L ~ (175 ± 35) km
ReactorneContribution at Kamioka • 86%:(175±35)km • 97%:Japanese stations • 2.2%:Korean〃〃 • 0.2%:European 〃〃 • 0.12%:Taiwanese〃〃 • 0.12%:North American〃 no. of neutrinos distance from Kamioka (km)
How to Detect ne in Liquid Scintillator ne + p e+ + n ne inverse b – decay : prompt signal En ~ Ee+ + 0.8 MeV Eth = 1.8 MeV e+ delayed signal p g (2.2 MeV) n d ~210 ms delayed coincidence method : prompt e+ + delayed g (2.2 MeV) high rejection-power for background events
Prompt vs. Delayed Energy for ne Candidate Events Expect 1.5 n-12C captures 2.6 MeV <Eprompt< 8.5 MeV geoneutrino region 1.8 MeV <Edelayed< 2.6 MeV Accidental background 2.6 MeV
(Nobs – NBG)/Nexpected =0.686 ± 0.044 (stat) ± 0.045 (syst) disappearance with 99.995 % CL Evidence for Reactor ne Disappearance Time Dependence of Event Rate expected(no oscillation) observed exposure 766.3 ton•yr observed ev. 258 expected ev. 365 ± 24 background ev. 17.8 ± 7.3
Null Shape-Distortion 2-Flavor Oscillation Fit Evidence of Reactor ne Spectral Distortion excluded at 99.8 % CL best fit with rate + spectrum shape Dm2 (eV2) = 7.9 x 10⁻⁵ sin2 2q = 0.98 un-binned likelihood fit : c2/d.o.f. = 24.2/17 +0.6 - 0.5
+ allowed allowed disfavored at 98.0% C.L. LMA-II LMA-I LMA-0 disfavored at 97.5% C.L. LMA Dm2 = 8.0 x 10⁻⁵ eV2 , sin2 2q = 0.98 ne nx Constraints on Oscillation Parameters event rate spectral shape excluded
Observation of Neutrino Oscillation Pattern definite baseline (~ 180 km) ⇒ test oscillation hypothesis evidence of neutrino oscillation at 99.8% C.L. !!! Nobs / Nexp (L0≡180 km) L/E (km/MeV) Δm2=7.9x10⁻⁵ eV2 sin22θ=0.98
+ 0.6 – 0.5 Dm2 = 7.9 x 10⁻⁵ eV2 tan2q = 0.40 + 0.09 – 0.07 2-Flavor Oscillations (All Solar + KamLAND) assuming CPT invariance the most precise determination ofDm2to date
A. Smirnov,n2002 Solutions to Solar Neutrino Problem KamLAND KamLAND solved the solar neutrino problem under the laboratory conditions (J. Bahcall)
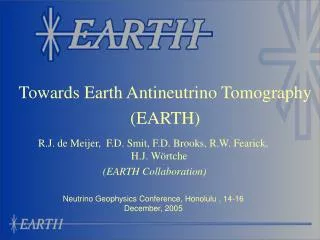
Heat Generation : basic factor ne U, Th, K decays: radiogenic heat Interior Dynamics Formation History geoneutrino detection ne Experimental Investigation of Geologically Produced Antineutrinos Earth : Antineutrino Star
new idea : georeactor ????????? cooling ~20 TW ??? radiogenic U/Th/K ~20 TW ??? Heat Balance between Dissipation and Generation heat dissipation 44 TW or 31 TW generation ≡ mW m-2
ne Energy Spectra of 238U, 232Th and 40K Decays 238U 206Pb + 8 4He + 6 e- + 6 ne + 51.7 MeV 232Th 208Pb + 6 4He + 4 e- + 4 ne + 42.7 MeV 40K 40Ca + e- + ne + 1.31 MeV (89.3 %) 40K + e- 40Ar + ne + 1.51 MeV (10.7 %) 1.8 MeV U+Th Number of antineutrinos (1/MeV/decay) U Antineutrino
upper U: 2.8, Th: 10.7 middle U: 1.6, Th: 6.1 lower U: 0.2, Th: 1.2 Crust U: 0.10, Th: 0.22 Sediment continental U: 2.8, Th: 10.7 oceanic U: 1.7, Th: 6.9 outer / inner U: 0, Th: 0 Mantle Core upper / lower U: 0.012, Th: 0.048 (units: ppm) Our Reference Earth Model [Th] /[U] ~3.9
cumulative geoneutrino flux (U-chain) Cumulative Flux (1/cm2/sec) crust ~70% mantle ~25% sediment <5% Geoneutrino Production in Our Reference Model geoneutrino production points observed by KamLAND km km
Background # of events 2.38 ±0.01 Accidental Coincidence Events/0.17 MeV 42 ±11 13C (a,n) 16O Reactor ne short lived long lived best fit 80.4 ±7.2 1.9 ±0.2 Antineutrino Energy (MeV) Total 127 ±13 [U]+[Th] = 19 ev Energy Distributions of Candidate & Background Events # of geoneutrinos: 25 events signal 152
Maximum Likelihood Analysis for Geoneutrino Flux confidence interval for # of detected geoneutrinos Th/U~3.9 CL 68.3% CL 95.4% CL 99.7% reference model NU + NTh best fit (NU – NTh)/(NU + NTh) # of U,Th: free parameter, (Dm2,sin22q): best fit value±1s, 13C(a,n)16O: peak width & height: free parameter
total number of geoneutrinos: U+Th (best fit) : 28 U+Th (rate analysis) : 25 99% confidence upper limit of ne flux: Dc2 1.45x10⁻³¹ne/(target proton•year) 1.62x107 cm-2s-1 at KamLAND 60 TW from our reference model 28 First Geoneutrino Results Assuming Th/U~3.9 KamLAND observed BSE prediction
Conclusion KamLAND Collaboration (China-France-Japan-US) KamLAND : Antineutrino Physics Frontier
a - source in LS a 210Pb 210Bi 210Po 206Pb prompt 22.3 y 5.013 d 138.4 d stable g (6.13 MeV) e+e- (6.05MeV) 16O* + 17O* 13C recoil proton + delayed p n ( 1.1% in 12C) n (2.2 MeV) 12C* prompt p recoil proton g (4.4 MeV) 13C (a,n) 16O* Correlated Background (long-lived Rn decay product)
t:178.3 ms 9Li b n 8Be+n 9Be Qdeposit > 106 p.e. DTm < 0.5 s 0.5< DT< 1 ms DR < 2 m 9Li Survived Background Sources background rate: 0.03 ev/day
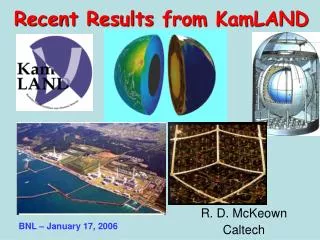
Ratio of Observed to Expected ne Flux for Reactor Neutrino Experiments Nobs/Nnooscillation KamLAND LMA: Dm2 = 5.5x10⁻⁵ eV2 sin2 2Q = 0.833
KamLAND neutrino tomography Future Plan SNO+ Finland
ne Event Selection prompt delayed ①inverseb - decay selection 2.6 < Eprompt < 8.5 MeV 1.8 < Edelay <2.6 MeV 0.5 < DT< 1000 ms DL < 2 m no OD signals tagging efficiency 89.8% ②m-induced spallation event cut DTm< 2 s for showering/bad m DTm < 2 s & DLm< 3m along m dead-time 9.7% ③fiducial selection R < 5.5 m : 543.7 ton ④data sample (2nd result): 515.1 days exposure time = 766.3 ton-year
Decay* excluded at 95% CL Decoherence† excluded at 94% CL *V.Barger et al. Phys. Rev. Lett. 82 (1999) 2640 †E.Lisi et al., Phys. Rev. Lett. 85 (2000) 1166 More exotic, non-oscillations models for the antineutrino channel start being less favored by data
Grandfather : G. Gamow, Letter to F. Reines (1953) Geoneutrino Fathers and Grandfather Fathers : G. Eder, Terrestrial Neutrinos, Nucl. Phys. 78, 657 (1966) G.Marx, Geophysics by Neutrinos, Czechoslovak J. Phys. B19, 1471 (1969)
0.9<Eprompt <2.7 MeV DT DL Space and Time Correlations between Prompt and Delayed Events 0.5<DT<500 ms 0<DL<100 cm
τ=29.1ms Q=13.4MeV τ=15.9ms Q=17.3MeV distribution: uniformly in space 12B 150 ms <DT< 10 ms DL < 3 m 12N 12B 12N Systematic Errors (for reactor neutrino flux)
Nuclear reactors are very intense sources of ne from the b-decays of neutron-rich fragments : 235U + n N1+ N2+ xn +6.1 b- + 6.1 ne + (201.8±0.5 MeV) 1/3 of total ne’s Antineutrinos are detected through inverse b-decay : ne + p e+ + n Eth = 1.8 MeV Eprompt (e+) = En - 0.8 MeV 2-step signature : prompt : e+ ionization, annihilation delayed : thermal neutron capture on p Edelayed (g) = 2.2 MeV, Dt ~ 200 ms νe+p→n+e+ cross section Ev (MeV) 2. Oscillation Studies by Reactor Antineutrinos Reactor Antineutrinos
free parameter in likelihood analysis peak height for reactor neutrinos peak height & width for geoneutrinos Expected Energy Spectra of 13C (a,n) 16O*, 16O Correlated Events geo-n reactor 13C( , n) 16O (n, p) 12C(n, ng) 12C 13C( , n) 16O*
Time Dependence of Observed Event Rate expected (no oscillation) ···· best fit observed 90% CL fit constrained through expected background (0.03 events/day)
U/Th in Japan and near Kamioka Sediment thickness latitude (deg.) Crustal thickness longitude (deg.) More Data
Background Level in KamLAND-II 14,11,10C : major background sources KamLAND-II
Expected Energy Spectrum of Single Events in KamLAND-II 3 years data 7Be 11C CNO pep