Download

1 / 62
760 likes | 1.29k Vues
Chapter 7 Funds Analysis, Cash-Flow Analysis, and Financial Planning. Learning Objectives. After studying Chapter 7, you should be able to:

E N D
Chapter 7Funds Analysis, Cash-Flow Analysis, and Financial Planning
Learning Objectives After studying Chapter 7, you should be able to: • Explain the difference between the flow of funds (sources and uses of funds) statement and the statement of cash flows -- and understand the benefits of using each. • Define "funds" and identify sources and uses of funds. • Create a sources and uses of funds statement, make adjustments, and analyze the final results. • Describe the purpose and content of the statement of cash flows as well as implications that can be drawn from it. • Prepare a cash budget from forecasts of sales, receipts, and disbursements -- and know why such a budget should be flexible. • Develop forecasted balance sheets and income statements. • Understand the importance of using probabilistic information in forecasting financial statements and evaluating a firm's condition.
Topics • Flow of Funds (Sources and Uses) Statement • Accounting Statement of Cash Flows • Cash-Flow Forecasting • Range of Cash-Flow Estimates • Forecasting Financial Statements
Flow of Funds Statement Has been replaced by the cash flow statement(1989) in U.S. audited annual reports. A summary of a firm’s changes in financial position from one period to another; it is also called a sources and uses of funds statement or a statement of changes in financial position.
Why Examine the Flow of Funds Statement QUESTION? Why should we bother to understand a Flow of Funds Statement that is no longer required to appear in U.S. audited annual reports?
Includes important noncash transactions while the cash flow statement does not. Is easy to prepare and often preferred by managers for analysis purposes over the more complex cash flow statement. Helps you to better understand the cash flow statement, especially if it is prepared under the “indirect method.” The Flow of Funds Statement: Why Examine the Flow of Funds Statement
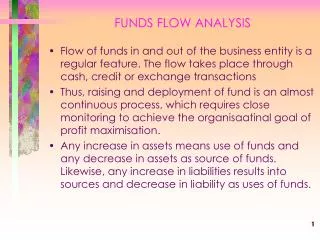
All of the firm’s investments and claims against those investments. Extends beyond just transactions involving cash. What are “funds”? Flow of Funds Statement
The letters labeling the boxes stand for Uses,Sources,Assets, and Liabilities(broadly defined). The pluses (minuses) indicate increases (decreases) in assets or liabilities. AL - + + - Sources and Uses Statement S U
$ 100 - S 410 - S 616 + U 5 -- 9 + U $ 1,140 N/A 930 N/A (299) N/A $ 631 + U 50 -- 223-- $ 2,044 Cash and C.E. $ 90 Acct. Rec. 394 Inventories 696 Prepaid Exp 5 Accum Tax Prepay 10 Current Assets$ 1,195 Fixed Assets (@Cost)1030 Less: Acc. Depr. (329) Net Fix. Assets $ 701 Investment, LT 50 Other Assets, LT 223 Total Assets $ 2,169 BW’s Determination of Sources and Uses Assets 2007 2006 +/- S/U
$ 100 $10 S 410 16 S 616 80 U 5 -- 9 1 U $ 1,140 N/A 930 N/A (299) N/A $ 631 70 U 50 -- 223-- $ 2,044 Cash and C.E. $ 90 Acct. Rec. 394 Inventories 696 Prepaid Exp5 Accum Tax Prepay 10 Current Assets$ 1,195 Fixed Assets (@Cost)1030 Less: Acc. Depr. (329) Net Fix. Assets $ 701 Investment, LT 50 Other Assets, LT 223 Total Assets $ 2,169 BW’s Determination of Sources and Uses Assets 2007 2006 +/- S/U
$ 295 - U 94 -- 16 -- 100 -- $505N/A 453 + S 200 -- 729 -- 157 + S $ 1086 N/A $ 2,044 Notes Payable $ 290 Acct. Payable94 Accrued Taxes 16 Other Accrued Liab. 100 Current Liab.$ 500 Long-Term Debt530 Shareholders’ Equity Com. Stock ($1 par)200 Add Pd in Capital729 Retained Earnings210 Total Equity $ 1,139 Total Liab/Equity$ 2,169 BW’s Determination of Sources and Uses Liabilities and Equity 2007 2006 +/- S/U
$ 295 $ 5 U 94 -- 16 -- 100 -- $505N/A 453 77 S 200 -- 729 -- 157 53 S $ 1086 N/A $ 2,044 Notes Payable $ 290 Acct. Payable94 Accrued Taxes 16 Other Accrued Liab. 100 Current Liab.$ 500 Long-Term Debt530 Shareholders’ Equity Com. Stock ($1 par)200 Add Pd in Capital729 Retained Earnings 210 Total Equity $ 1,139 Total Liab/Equity$ 2,169 BW’s Determination of Sources and Uses Liabilities and Equity 2007 2006 +/- S/U
USES$156 Increase, Inventories $80 Increase, Accum Tax Prepay 1 Decrease, Notes Payable 5 Increase, Net Fixed Assets 70 $156 SOURCES Increase, Retained Earnings $ 53 Decrease, Accounts Receivable 16 Increase, Long-Term Debt 77 Decrease, Cash + Cash Equivalents 10 “Basic” Sources and Uses Statement
Adjusting the “Basic” Sources and Uses Statement The following three slides are Basket Wonders’ Balance Sheet and Income Statement that was discussed in Chapter 6. This information will be needed to adjust the “basic” Sources and Uses Statement.
a. How the firm stands on a specific date. b. What BW owned. c. Amounts owed by customers. d. Future expense items already paid. e. Cash/likely convertible to cash within 1 year. f. Original amount paid. g. Acc. deductions for wear and tear. Cash and C.E. $ 90 Acct. Rec.c 394 Inventories 696 Prepaid Expd 5 Accum Tax Prepay 10Current Assetse $1,195 Fixed Assets (@Cost)f1030 Less: Acc. Depr. g (329) Net Fix. Assets$ 701 Investment, LT 50 Other Assets, LT 223Total Assets b $2,169 Basket Wonders’ Balance Sheet (Asset Side) Basket Wonders Balance Sheet (thousands) Dec. 31, 2007a
a. Note, Assets = Liabilities + Equity. b. What BW owed and ownership position. c. Owed to suppliers for goods and services. d. Unpaid wages, salaries, etc. e. Debts payable < 1 year. f. Debts payable > 1 year. g. Original investment. h. Earnings reinvested. Notes Payable $ 290 Acct. Payablec 94 Accrued Taxesd 16 Other Accrued Liab.d100Current Liab.e$ 500 Long-Term Debtf530Shareholders’ Equity Com. Stock ($1 par)g200Add Pd in Capitalg 729 Retained Earningsh210 Total Equity $1,139 Total Liab/Equitya,b$2,169 Basket Wonders’ Balance Sheet (Liability Side) Basket Wonders Balance Sheet (thousands) Dec. 31, 2007
a. Measures profitability over a time period. b. Received, or receivable, from customers. c. Sales comm., adv., officer’s salaries, etc. d. Operating income. e. Cost of borrowed funds. f. Taxable income. g. Amount earned for shareholders. Net Sales $ 2,211 Cost of Goods Soldb1,599 Gross Profit $ 612 SG&A Expenses c 402EBITd$ 210 Interest Expensee 59 EBT f$151Income Taxes 60 EATg$ 91 Cash Dividends 38 Increase in RE $ 53 Basket Wonders’ Income Statement Basket Wonders Statement of Earnings (in thousands) for Year Ending 12/31/2007a
Adjusting the “Basic” Sources and Uses Statement Recognize Profits and Dividends Change in retained earnings is composed of profits and dividends. Source: Net Profit $91 Less Use: Cash Dividends 38 (Net) Source: Incr., R.E. $53
Adjusting the “Basic” Sources and Uses Statement Recognize Depreciation and Gross Changes in Fixed Assets Change in net fixed assets is composed of depreciation and fixed assets. Source: Depreciation $ 30 Less Use: Add. to F.A. 100 (Net) Use: Incr., Net F.A. $ 70
SOURCES Funds provided by operations Net Profit $ 91 Depreciation 30 Decrease, Accounts Receivable 16 Increase, Long-Term Debt 77 Decrease, Cash + Cash Equivalents 10 $224 Sources and Uses Statement (Sources Side)
USES Dividends $ 38 Additions to fixed assets 100 Increase, Inventories 80 Increase, Accum. Tax Prepay 1 Decrease, Notes Payable 5 224 Sources and Uses Statement (Uses Side)
Uses Primarily through an increase in inventories and expenditures on capital assets. Sources Primarily through net profit from operations and long-term debt increases. Analyzing the Sources and Uses Statement
operating activities, investing activities, and financing activities. This statement reports cash inflows and outflows based on the firm’s Statement of Cash Flows A summary of a firm’s payments during a period of time.
Statement of Cash Flows Cash Flow from Operating Activities Shows impact of transactions not defined as investing or financing activities. • These cash flows are generally the cash effects of transactions that enter into the determination of net income.
Cash Inflows From sales of goods or services From interest and dividend income Cash Outflows To pay suppliers for inventory To pay employees for services To pay lenders (interest) To pay government for taxes To pay other suppliers for other operating expenses Cash Flow From Operating Activities
Cash Flow From Operating Activities It would seem more logical to classify interest and dividend income as an “investing” inflow, while interest paid certainly looks like a “financing” outflow. But, the U.S. Financial Accounting Standards Board -- by a slim 4 to 3 vote -- classified these items as “operating” flows.
Cash Flow from Financing Activities Shows impact of all cash transactions with shareholders and the borrowing and repaying transactions with lenders. Cash Flow from Investing Activities Shows impact of buying and selling fixed assets and debt or equity securities of other entities. Statement of Cash Flows
Cash Inflows From sale of fixed assets (property, plant, equipment) From sale of debt or equity securities (other than common equity) of other entities Cash Outflows To acquire fixed assets (property, plant, equipment) To purchase debt or equity securities (other than common equity) of other entities Cash Flow From Investing Activities
Cash Inflows From borrowing From the sale of the firm’s own equity securities Cash Outflows To repay amounts borrowed To repurchase the firm’s own equity securities To pay shareholders dividends Cash Flow From Financing Activities
Cash Flow from Operating Activities Net Income $ 91 Depreciation 30 Decrease, accounts receivable 16 Increase, inventories ( 80) Increase, accum. tax prepay ( 1) Net cash provided (used) by operating activities $ 56 Indirect Method – Statement of Cash Flows
Cash Flow from Investing Activities Additions to Fixed Assets $(100) Net cash provided (used) by investing activities $(100) Indirect Method – Statement of Cash Flows
Cash Flow from Financing Activities Increase, notes payable $ ( 5) Increase, long-term debt 77 Dividends paid ( 38) Net cash provided (used) by financing activities $ 34 Indirect Method – Statement of Cash Flows
Increase (decrease) in cash and cash equivalents $ ( 10) Cash and cash equivalents, 2006 100 Cash and cash equivalents, 2007 $ 90 Supplemental cash flow disclosures Interest paid $ 59 Taxes paid 60 Indirect Method – Statement of Cash Flows
Cash Flow from Operating Activities Cash received from customersa $2,227 Cash paid to suppliers and employeesb(2,051) Interest paid ( 59) Taxes paidc ( 61) Net cash provided (used) by operating activities $ 56 Direct Method – Statement of Cash Flows a, b, cSee Worksheet on next slide for calculation
Sales $2,211 +(-) Decrease (increase) in AR 16 Cash received from customers $2,227 COGS - Depreciation + SGA $1,971 +(-) Increase (decrease) in inventory 80 Cash paid to suppliers and employees $2,051 Income taxes (federal / state) $ 60 +(-) Incr (Decr) in accum. tax prepay 1 Taxes paid $ 61 Worksheet for Preparing Operating Activities Section (a) (b) (c)
Cash Flow from Investing Activities Additions to Fixed Assets $(100) Net cash provided (used) by investing activities $(100) Direct Method – Statement of Cash Flows
Cash Flow from Financing Activities Decrease, notes payable $ ( 5) Increase, long-term debt 77 Dividends paid ( 38) Net cash provided (used) by financing activities $ 34 Direct Method – Statement of Cash Flows
Increase (decrease) in cash and C.E. $ ( 10) Cash and cash equivalents, 2006 100 Cash and cash equivalents, 2007 $ 90 Supplemental cash flow disclosures Net Income $ 91 Depreciation 30 Decrease, accounts receivable 16 Increase, inventories ( 80) Increase, accum. tax prepay ( 1) Net cash provided (used) by operating activities $ 56 Direct Method – Statement of Cash Flows
Determine the future cash needs of the firm Plan for the financing of these needs Exercise control over cash and liquidity of the firm ACash Budgetis a forecast of a firm’s future cash flows arising from collections and disbursements, usually on a monthly basis. The financial manager is better able to: Cash Flow Forecasting
Sales representatives project sales for the period in question (sales under their control or management). Sales projections are screened and consolidated for product lines. Product line sales projections are consolidated into a single forecast. Internal Sales Forecast The Sales Forecast
Economists project overall economic and business trends that will affect the firm. Expected market share is projected for current and new product lines. Product line sales projections are consolidated into a single forecast. External Sales Forecast The Sales Forecast
Lisa Miller has finalized a cash flow forecast for the first six months of 2008. Lisa is expecting 90% of monthly sales will be credit sales with 80% of credit sales collected in 30 days, 20% in 60 days, and no “bad debts.” Hint: The cash flow forecast will be used in forecasting the financial statements later in this chapter. BW’s Cash Flow Forecast
Collections and Other Cash Receipts (Thousands) SALES NOV DEC JAN FEB Credit Sales, 90% $193 $212 $154 $135 Cash Sales, 10% 21 24 17 15 Total Sales, 100% $214 $236 $171 $150 CASH COLLECTIONS Cash sales, current $ 17 $ 15 80% of last month’s 169 123 credit sales 20% of 2-month-old 39 42 credit sales Total sales receipts $225 $180
Collections and Other Cash Receipts (Thousands) SALES MAR APR MAY JUN Credit Sales, 90% $256 $205 $160 $190 Cash Sales, 10% 28 23 18 21 Total Sales, 100% $284 $228 $178 $211 CASH COLLECTIONS Cash sales, current $ 28 $ 23 $ 18 $ 21 80% of last month’s 108 205 164 128 credit sales 20% of 2-month-old 31 27 51 41 credit sales Total sales receipts $167 $255 $233 $190
Schedule of Projected Cash Disbursements (Thousands) DEC JAN FEB Purchases $ 39 $ 35 $ 64 CASH DISBURSEMENTS FOR PURCHASESAND OPERATING EXPENSES 100% of last month’s $ 39 $ 35 purchases Wages paid 90 94 Other expenses paid 34 34 Total disbursements (purchases and operating expenses) $163 $163
Schedule of Projected Cash Disbursements (Thousands) MAR APR MAY JUN Purchases $ 53 $ 40 $ 48 $ 50 CASH DISBURSEMENTS FOR PURCHASES AND OPERATING EXPENSES 100% of last month’s $ 64 $ 53 $ 40 $ 48 purchases Wages paid 111 107 92 92 Other expenses paid 34 34 34 34 Total disbursements $209 $194 $166 $174 (purchases and operating expenses)
Schedule of Net Cash Disbursements (Thousands) JANFEB MAR Total disbursements for $163 $163 $209 purchases and operating expenses Capital expenditures 70 40 0 Dividend payments 0 0 9 Income taxes 25 0 0 Total cash disbursements $258 $203 $218
Schedule of Net Cash Disbursements (Thousands) APRMAY JUN Total disbursements for $194 $166 $174 purchases and operating expenses Capital expenditures 0 0 0 Dividend payments 0 0 10 Income taxes 25 0 0 Total cash disbursements $219 $166 $184
Projected Net Cash Flows and Cash Balances JANFEBMAR Beginning cash balance $ 90 $ 57 $ 34 Total cash receipts 225 180 167 Total cash disbursements 258 203218 Net cash flow $(33) $(23) $(51) Ending cash balance without additional financing $ 57 $ 34 $( 17)
Projected Net Cash Flows and Cash Balances APRMAYJUN Beginning cash balance $( 17) $ 19 $ 86 Total cash receipts 255 233 190 Total cash disbursements 219 166184 Net cash flow $ 36 $ 67 $ 6 Ending cash balance without additional financing $ 19 $ 86 $ 92