Download
1 / 35
360 likes | 524 Vues
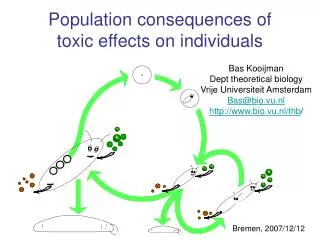
Population consequences of toxic effects on individuals. Bas Kooijman Dept theoretical biology Vrije Universiteit Amsterdam Bas@bio.vu.nl http://www.bio.vu.nl/thb /. Bremen, 2007/12/12. Population consequences of toxic effects on individuals. Contents : What is DEB theory?

E N D
Population consequences oftoxic effects on individuals Bas Kooijman Dept theoretical biology Vrije Universiteit Amsterdam Bas@bio.vu.nl http://www.bio.vu.nl/thb/ Bremen, 2007/12/12
Population consequences oftoxic effects on individuals • Contents: • What is DEB theory? • Individuals populations • Populations ecosystems • Toxic effects on individuals • Scaling relationships • Toxic effects on populations Bas Kooijman Dept theoretical biology Vrije Universiteit Amsterdam Bas@bio.vu.nl http://www.bio.vu.nl/thb/ Bremen, 2007/12/12
Dynamic Energy Budget theory for metabolic organization • consists of a set of consistent and coherent assumptions • uses framework of general systems theory • links levels of organization • scales in space and time: scale separation • quantitative; first principles only • equivalent of theoretical physics • interplay between biology, mathematics, • physics, chemistry, earth system sciences • fundamental to biology; many practical applications
Individual Ecosystem • population dynamics is derived from • properties of individuals + interactions between them • evolution according to Darwin: • variation between individuals + selection • material and energy balances: • most easy for individuals • individuals are the survival machines of life
storage product formation maturation growth reproduction aging feeding digestion maintenance Standard DEB model Isomorph with 1 reserve & 1 structure feeds on 1 type of food has 3 life stages (embryo, juvenile, adult) Processes: Balances: mass, energy , entropy, time • Extensions: • more types of food and food qualities • more types of reserve (autotrophs) • more types of structure (organs, plants) • changes in morphology • different number of life stages
Fundamental knowledge of metabolic organisation has many practical applications Applications of DEB theory • bioproduction: agronomy, aquaculture, fisheries • pest control • biotechnology, sewage treatment, biodegradation • (eco)toxicology, pharmacology • medicine: cancer biology, obesity, nutrition biology • global change: biogeochemical climate modeling • conservation biology; biodiversity • economy; sustainable development
DEB theory is axiomatic, based on mechanisms not meant to glue empirical models Since many empirical models turn out to be special cases of DEB theory the data behind these models support DEB theory This makes DEB theory very well tested against data DEB theory reveals when to expect deviations from these empirical models Empirical special cases of DEB
Individuals Populations Populations: collections of individuals individuals follow trajectories in i-states during life cycle individual interact (e.g. competition for food) Physiologically-structured population dynamics Individuality: more important if ratio between weights of adults and neonates increases. Less important for unicellulars that divide into two daughters Population dynamics requires modelling of resources (nutrient recycling, syntrophy)
specific growth rate specified by model Individuals Populations 9.2.2 Steady state: Euler-Lotka equation
1-species mixotroph community 9.4 Mixotrophs are producers, which live off light and nutrients as well as decomposers, which live off organic compounds which they produce by aging Simplest community with full material cycling
1-species mixotroph community 9.4 Cumulative amounts in a closed community as function of total C, N, light E: reserve V: structure DE: reserve-detritus DV: structure-detritus rest: DIC or DIN Note: absolute amount of detritus is constant
Canonical community 9.4 Short time scale: Mass recycling in a community closed for mass open for energy Long time scale: Nutrients leaks and influxes Memory is controlled by life span (links to body size) Spatial coherence is controlled by transport (links to body size)
biomass detritus nutrient consumer producer decomposer nutrient 1-spec. vs canon. community 9.4 biomass 1-species: mixotroph community Total nitrogen Total carbon detritus nutrient consumer 3-species: canonical community Total nitrogen Total carbon producer decomposer Total carbon Total nitrogen
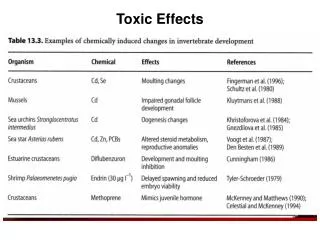
Biology based methods Effects based on internal concentrations One compartment accumulation-elimination Hazard rate or physiological target parameter is linear in internal concentration (small effects only) Dynamic Energy Budget theory is used to identify potential target parameters translate change in parameter to change in endpoint Interaction of compounds in mixture product of internal concentrations similar to analysis of variance
assimilation maintenance costs defecation feeding food faeces growth costs assimilation reproduction costs reserve hazard to embryo somatic maintenance 7 maturity maintenance 1- maint tumour induction 6 maturation reproduction u endocr. disruption growth 7 lethal effects: hazard rate Mode of action affects translation to pop level 8 maturity offspring structure tumour 6 Modes of action of toxicants
Change in target parameter Simplest basis: Change internal conc that exceeds internal NEC • Rationale • effective molecules operate independently • approximation for small effects
Hazard model Suppose that the elimination rate is large internal conc is fast at equilibrium, hazard rate is constant Conclusion: effect on survival concentration exposure time well known in pharmacology desinfection of buildings, green houses
Effect on survival for single compound Effects of Dieldrin on survival of Poecilia NEC 4.49 g l-1 killing rate 0.038 l g-1 d-1 elimination rate 0.712 d-1
Effect on survival for mixture Model for survival in time for a binary mixture: 8 parameters in total using data for all observation times control mortality rate, interaction parameter 2 (NEC, killing rate, elimination rate) Model tested for 6 binary mixtures of metals (Cu, Cd, Pb & Zn) on Folsomia candida (Collembola) Survival measurements daily for 21 days 6 6 concentrations 22 6 6 = 792 data points for each mixture
Cd & Cu survival of Folsomia Interaction Cu,Cd, Pb, Zn: Cu & Pb: slightly antagonistic Other combinations: nill Folsomia candida Data: Bart van Houte Theory: Bas Kooijman Fit: Jan Baas Movie: Jorn Bruggeman
Effect on assimilation 6.4.3 weight1/3, mg1/3 time, d CuCl2 mg/kg Data from Klok & de Roos 1996 NEC = 4.45 mg CuCl2 /kg on Lumbricus rubellus
indirect effects mg kg-1 Effects on growth 0, 0, 64,139 300 646 body length, mm 1392 Triphenyltin on Folsomia candida at 20°C 3000 assimilation direct effects body length, mm maintenance growth time, d time, d
indirect effects Effects on reproduction mg L-1 0, 320 assimilation 560 1000 cum # offspring/♀ Phenol on Daphnia magna at 20°C 1800 3200 direct effects maintenance cost/offspring cum # offspring/♀ growth hazard cum # offspring/♀ time, d time, d
Primary scaling relationships assimilation {JEAm} max surface-specific assim rate Lm feeding {b} surface- specific searching rate digestion yEX yield of reserve on food growth yVEyield of structure on reserve mobilization v energy conductance heating,osmosis {JET} surface-specific somatic maint. costs turnover,activity [JEM] volume-specific somatic maint. costs regulation,defence kJ maturity maintenance rate coefficient allocation partitioning fraction egg formation R reproduction efficiency life cycle [MHb] volume-specific maturity at birth life cycle [MHp] volume-specific maturity at puberty aging ha aging acceleration Kooijman 1986 J. Theor. Biol. 121: 269-282 maximum length Lm = {JEAm} / [JEM]
Metabolic rate slope = 1 Log metabolic rate, w O2 consumption, l/h 2 curves fitted: endotherms 0.0226 L2 + 0.0185 L3 0.0516 L2.44 ectotherms slope = 2/3 unicellulars Log weight, g Length, cm Intra-species Inter-species (Daphnia pulex)
QSARs for tox parameters Slope = -0.5 Slope = 1 Slope = -1 10log elim rate, d-1 10log kill rate, mM-1 d-1 10log NEC, mM 10log Pow 10log Pow 10log Pow Assumption: Each molecule has same effect Alkyl benzenes in Pimephales Data from Geiger et al 1990 • Hazard model for survival: • one compartment kinetics • hazard rate linear in internal concentration
QSARs for tox parameters Slope = -0.5 Slope = 1 Slope = -1 10log elim rate, d-1 10log kill rate, mM-1 d-1 10log NEC, mM 10log Pow 10log Pow 10log Pow Benzenes, alifates, phenols in Pimephales Data from Mackay et al 1992, Hawker & Connell 1985 Assumption: Each molecule has same effect • Hazard model for survival: • one compartment kinetics • hazard rate linear in internal concentration
Covariation of tox parameters Slope = -1 10log NEC, mM 10log killing rate, mM-1 d-1 Pimephales Data from Gerritsen 1997
QSARs for LC50’s 10log LC50.14d, M 10log Pow 10log Pow LC50.14d of chlorinated hydrocarbons for Poecilia. Data: Könemann, 1980
SimilaritiesQSAR body size scaling 1-compartment model: partition coefficient (= state) is ratio between uptake and elimination rate DEB-model: maximum length (= state) is ratio between assimilation and maintenance rate Parameters are constant for a system, but vary between systems in a way that follows from the model structure
InteractionsQSAR body size scaling • uptake, elimination fluxes, food uptake surface area (intra-specifically) • elimination rate length-1 (exposure time should depend on size) • food uptake structural volume (inter-specifically) • dilution by growth affects toxicokinetics • max growth length2 (inter-specifically) • elimination via reproduction: max reprod mass flux length2 (inter-specifically) • chemical composition: reserve capacity length4 (inter-specifically) • in some taxa reserve is enriched in lipids • chemical transformation, excretion is coupled to metabolic rate • metabolic rate scales between length2 and length3 • juvenile period length, abundance length-3 , pop growth rate length-1 • links with risk assessment strategies
Maintenance first 9.2.3 Chlorella-fed batch cultures of Daphnia magna, 20°C neonates at 0 d: 10 winter eggs at 37 d: 0, 0, 1, 3, 1, 38 Kooijman, 1985 Toxicity at population level. In: Cairns, J. (ed) Multispecies toxicity testing. Pergamon Press, New York, pp 143 - 164 30106 cells.day-1 400 Maitenance requirements: 6 cells.sec-1.daphnid-1 300 300 number of daphnids max number of daphnids 200 200 100 100 106 cells.day-1 0 0 6 12 30 60 120 8 11 15 18 21 24 28 32 35 37 30 time, d
Food intake at carrying capacity 6.4.7 metavanadate sodium bromide 2,6-dimethylquinoline 103 cells/daphnid.d log mg Br/l log mg DMQ/l log mg V/l potassium dichromate colchicine 9-aminoacridine 103 cells/daphnid.d log mg AA/l log mg Col/l log mg K2Cr2O7/l
Population effects can depend on food density 6.4.7 3,4-dichloroaniline direct effect on reproduction potassium metavanadate effect on maintenance Population growth of rotifer Brachionus rubens at 20˚C for different algal concentrations
DEB tele course 2009 Cambridge Univ Press 2000 http://www.bio.vu.nl/thb/deb/ Free of financial costs; some 250 h effort investment Program for 2009: Feb/Mar general theory April symposium in Brest (2-3 d) Sept/Oct case studies & applications Target audience: PhD students We encourage participation in groups who organize local meetings weekly Software package DEBtool for Octave/ Matlab freely downloadable Slides of this presentation are downloadable from http://www.bio.vu.nl/thb/users/bas/lectures/ Audience: thank you for your attention Organizers: thank you for the invitation