Download
1 / 1
10 likes | 171 Vues
Does Schema-Based Instruction and Self-Monitoring Influence Seventh Grade Students’ Proportional Thinking? Asha Jitendra, University of Minnesota Jon R. Star, Harvard University John Woodward, University of Washington at Puget Sound . Abstract

E N D
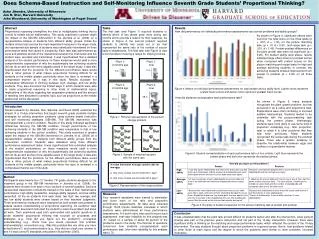
Does Schema-Based Instruction and Self-Monitoring Influence Seventh Grade Students’ Proportional Thinking? Asha Jitendra, University of Minnesota Jon R. Star, Harvard University John Woodward, University of Washington at Puget Sound Abstract Proportional reasoning exemplifies the kind of multiplicative thinking that is central to middle school mathematics. This study examined in greater depth the impact of the SBI-SM intervention in the Jitendra et al. (2008) on a representative sample of students from different ability groups. Unlike the multiple choice test used as the main dependent measure in the larger study, the represented sub-sample of students was individually interviewed on three performance tasks that varied in complexity. Each task was administered as a pre and posttest, and all of the interactions between the interviewer and the student were recorded and transcribed. It was hypothesized that a detailed analysis of the student performance on these measures would yield a more comprehensive explanation of why the academically low achieving students did not do as well as their more capable peers in the larger study. It was also hypothesized that the protocols for the different performance tasks would offer a richer picture of what makes proportional thinking difficult for all students at the middle grades, particularly when the topic is reviewed in a compressed manner as it was in this study. Results elucidate the comparative differences in thinking between high, average, and low ability students. They also document the limited ways in which students were able to relate proportional reasoning to other kinds of mathematical topics. Implications of the study regarding test preparation practices and the amount of teaching time allocated to complex topic such as proportions at the middle grade level will be discussed. Tasks The first task (see Figure 1) required students to identify which of two plants grew more during two months and to provide a reason for their response. As shown in Figure 2, the second problem required students to identify two cards out of six that represented the same ratio of the number of soccer balls to skateboards. The final task (see Figure 3) was a word problem involving a recipe for making cookies. Results How did performance on individual performance assessments vary across problems and ability groups? As shown in Figure 4, significant effects were found for the total score on the three tasks (p < .001, d = 1.18), on the picture matching task, (p < .01 d = 0.91), and recipe task (p < .001, d = 1.49). Pretest-posttest differences on the plant growth task were not significant (p = 0.26). For student ability level status, results indicated large effect sizes for posttest scores when compared with pretest scores on the picture matching and recipe tasks for high and average achieving students. In contrast, low achieving students showed improvement from pretest to posttest (d > 0.90) on all three tasks. Plant 1: 2 months ago Plant 1: now 11 in. 8 in. Plant 2: 2 months ago Plant 2: now Figure 4. Means on individual performance assessments for total sample and by ability level. Lighter colors represent pretest mean scores and darker colors represent posttest mean scores. 28 in. How did students conceptualize each performance task? 25 in. As shown in Figure 5, many students recognized the plant growth problem, but few perceived it as a ratios and proportions task. Explanations were often confusing or involved additive relationships. Students tended to be unfamiliar with the picture-matching task during the pretest phase. Interestingly, students were most likely to use some kind of proportion vocabulary (e.g., ratio, proportion, rate) to relate it to other problems that they had seen previously. Many students recognized the recipe task during the posttest phase. There was a greater tendency to describe the relationship between eggs and cookies in a quantitative manner. Introduction Recent research by Jitendra, Star, Starosta, and Sood (2008) examined the impact of a 10-day intervention that taught seventh grade students multiple strategies for solving proportion problems using schema based instruction and self monitoring strategies (SBI-SM). The SBI-SM intervention was contrasted with a control condition. Results of this study indicated significant differences favoring the SBI-SM condition, though performance of low achieving students in the SBI-SM condition was comparable to that of low achieving students in the control condition. This study examined in greater depth the impact of the SBI-SM intervention in Jitendra et al. (2008) on a representative sample of students from different ability groups from the intervention condition. Students were assessed using three different performance assessment tasks. It was hypothesized that a detailed analysis of the student performance on these measures would yield a more comprehensive explanation of why the academically low achieving students did not do as well as their more capable peers in the larger study. It was also hypothesized that the protocols for the different performance tasks would offer a richer picture of what makes proportional thinking difficult for all students at the middle grades, particularly when the topic is reviewed in a compressed manner as in this study. Figure 1. Pictorial representation of the percent change problem Figure 5. Student conceptualization of each performance task on four criteria. Light blue represents the pretest phase and dark blue represents the posttest phase. Figure 2. Sample of matched squares with the same ratio A recipe that makes 40 sugar cookies calls for two eggs. a) How many cookies can be made with 1 egg? b) How many cookies can be made with 3 eggs? Method Participants were twenty-four (17 female) 7th grade students assigned to the treatment group in the SBI-SM intervention in Jitendra et al. (2008).Six students were chosen from each of four sections of seventh graders. Sections represented classrooms of students tracked on the basis of their mathematics performance: high ability (academic), average ability (applied), and low ability (essential). Of the six students from each class, two high, two average, and two low ability students were chosen based on their teachers’ judgments. Three performance measures were employed as both pretest and posttest to assess student understanding of proportional reasoning. An examiner read each problem aloud and instructed the student to solve the problem and show all work. Then examiners used both open-ended and specific questions to probe students’ proportional thinking that focused on processes and strategies (e.g., How did you figure out the problem?), conceptual understanding (e.g., Show how you would represent this problem mathematically), connections (e.g., Was this problem like any other you have solved before?), and communication (e.g., How did you check your answer to see if it was correct?) standards articulated in Buschman (2003). Figure 3. Representation of the recipe problem Measures Four research assistants were trained to administer and score each of the ratio and proportion performance assessments. All data were collected through 15-20 minute individual interviews in which students were administered all three performance assessments. A 5-point rubric was used to score each assessment. Inter-rater reliability for this analysis was .87, based on a sample of about 60 percent of the problems used in the study.The final set of questions concerned how students conceptualized each performance task. Inter-rater reliability for this analysis was 0.79. Figure 6. Excerpts of student responses for the picture-matching task at pretest and posttest Conclusion It was understandable that the plant task proved difficult for students before and after the intervention, since percent change was part of the previous year’s instruction and not part of the 10-day intervention. However, there were significant shifts in thinking on the matching and recipe performance tasks, which reflected the content of the 10-day intervention. The way students thought about proportion problems in a general sense, that is, how problems related to other kinds of math topics and the degree to which the problems were similar to other problems, informed instruction.


