Download
1 / 28
300 likes | 584 Vues
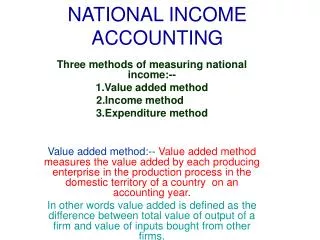
National Income Analysis. National Income- Meaning. It is a sum total of factor incomes accruing to normal residents of a country within an accounting year. Th e concept of National Income can be explained from three sides – I) Production II ) Income and III) Expenditure.

E N D
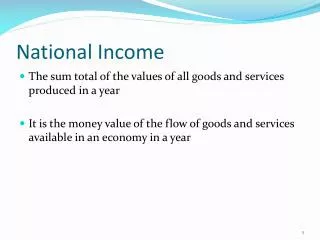
National Income- Meaning • It is a sum total of factor incomes accruing to normal residents of a country within an accounting year. • The concept of National Income can be explained from three sides – I) Production II) Income and III) Expenditure
DEFINITIONS • Central Statistical Organization: - “National Income is the sum total of factor incomes earned by the normal residents of a country in the form of wages, rent, interest and profit in an accounting year”. • Prof. Kuznets: - “The sum total of the market value of final goods and services, produced by normal residents of a country in one year is known as national product.”
Circular flow diagram • summarizes the transactions between the different economic agents • agents: households, firms (business), government, and foreigners (rest of the world)
Circular flow diagram • Assumption: The economy composed of households and firms only • Households: own factors of production, consume goods and service • Firms: hire factors of production to produce goods and services
payments for goods and services goods and services FIRMS HOUSEHOLDS factor services factor payments (wages, interest, rent, profit) FIGURE 8.1. Circular flow diagram. The diagram above represents the transactions between firms and households in a simple economy. In the upper loop, the arrow emanating from firms to households represents the sale by firms of goods and services to households. On the other hand, the arrow from households to firms represents the payments. n the lower loop, the arrow originating from the households to the firms shows that firms hire labor and capital from households in order to produce goods and services. The arrow emanating from the firms indicates their payments for the use of the factors of production.
Revenue (=GDP) Spending (=GDP) MARKETS FOR GOODS AND SERVICES Good and services sold Good and services bought HOUSEHOLDS FIRMS Land, labor and capital Inputs for Production MARKETS FOR FACTORS OF PRODUCTION Income (=GDP) Wages, rent, interest and profit (=GDP) Flow of goods & services Flow of money: pesos THE CIRCULAR FLOW DIAGRAM
Transfer payments • Transfer payments – are transactions wherein one party is not obliged to deliver a good or service in return for the payment. • Examples: retirement benefits, unemployment benefits, scholarships, and donations.
Concepts/Aggregates of National Income • Gross Domestic Product at Market Price (GDPMP) • Gross National Product at Market Price (GDPMP) • Net National Product at Market Price (NNPMP) • Net Domestic Product at Market Price (NDPMP) • Gross Domestic Product at Factor Cost (GDPFC) • Gross National Product at Factor Cost (GNPFC) • Net National Product at Factor Cost (NNPFC) • Net Domestic Product at Factor Cost (NDPFC) • Factor Income From Net Domestic Product Accruing to Private Sector • Private Income • Personal Income
Basic Concepts - • Domestic and National Concepts 1.Domestic Income = National Income – NFYA 2. National Income = Domestic Income + NFYA • Market Price and Factor Cost Concepts • Market Price = Factor Cost + NIT • Factor Cost = Market Price – NIT • Gross and Net Concepts • Gross Product = Net Product + Depreciation • Net product = Gross Product – Depreciation
Definition of GDP • The market value of good i (Vi) is equal to PiQi • GDP = sum of the market values of all final goods and services produced within the year.
GDP includes final goods and services only • Final goods - goods and services that are not purchased for the purpose of producing other goods and services or for resale • Eg. Rice (final) and palay or unhusked rice (intermediate product) • Including intermediate goods and final goods will result in “double counting”.
Approaches for measuring National Income • Value-added Approach – measures GDP as the sum of value added at each stage of production (from initial to final stage) • Income Approach (lower loop) – measures GDP as the sum of incomes of factors of production (wages, rent, interest and profit. • Expenditure Approach – measures GDP as the sum of expenditures on final goods and services.
Value Added Method STEPS – • Classification of Productive Enterprises • Calculation of Value Added • Value of Output • Value of Intermediate Consumption • Calculation of Domestic Income • Calculation of National Income
Suppose that rice is the only final product of an economy: It goes through several (3) stages of production. Value Added Approach
Cautions Regarding Value Added 1) Value of intermediate goods is not included in Product Method. 2) Value of second hand goods is not included in product method. 3) Imputed rent is included in this method.
Income Method STEPS • Classification of Productive Enterprises • Classification of Factor Income • Compensation of Employees (COE) • Operating Surplus (O.S.) • Mixed Income • Calculation of Domestic Income • Calculation of National Income
Cautions Regarding Income Methods • Windfall gains • Income from illegal activities • Transfer earnings • The sale and purchase of second hand goods • Imputed value of services
Expenditure Method STEPS • Identification and classification of Economic Units incurring Final Expenditure • Classification of Final Expenditure • Final Consumption Expenditure • Final Investment Expenditure • Calculation of Domestic Income
NDPFC = Private Final Consumption Expenditure + Government Final Consumption Expenditure + Gross Domestic Capital Expenditure (Gross Fixed Capital Formation + Change in Stock) + Net Exports (Exports – Imports)- Dep.-NIT • Calculation of National Income
Cautions Regarding Expenditure Method • Only final expenditure is included in national income. • Expenditure on shares and bonds are not included. • Expenditure on second hand goods is not included in national income. • Expenditure on transfer payments is not included in national income.
Nominal and Real GDP • GDP at current prices or nominal GDP -GDP measured using the prices of the year for which it is calculated • Nominal GDP can be a misleading indicator of changes in output or income because it also embodies changes in the prices of goods and services. • Real GDP or GDP at constant prices measures the total value of output using the prices of a selected year (the base year). • Real GDP better for analysis overtime because it eliminates the effects of price changes
GDP per capita • Measures how much output or income was produced or received, on the average, by an individual in an economy • Useful for comparing the performance of a country overtime and a country’s performance relative to its neighbors
Some Limitations of GDP or GNP as measures of growth • Ignores income distribution • Ignores environmental degradation • Does not include activities that do not go through the formal markets sectors • Does not include “illegal” activities like drug trafficking, prostitution, moonlighting