Download
1 / 1
10 likes | 110 Vues
This study assesses the PASAT-C's efficacy in inducing negative mood in college students and examines reactivity based on depressive symptom levels.

E N D
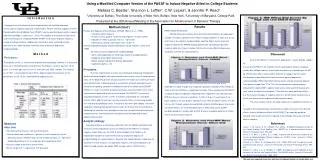
Using a Modified Computer Version of the PASAT to Induce Negative Affect in College Students Melissa C. Beattie1, Shannon L. Leffler1, C.W. Lejuez2, & Jennifer P. Read1 1University at Buffalo, The State University of New York, Buffalo, New York,2University of Maryland, College Park Presented at the 38th Annual Meeting of the Association for Advancement of Behavior Therapy Discussion Across two different measurement approaches, results provide support for the use of the PASAT-C for induction of stressed/negative affect in analogue studies with college students. Examination of patterns of responding on the AG by CES-D status offers some modest evidence to suggest that the mood Manipulation shows differential effects based on general depressive symptomatology. While Affect Grid valence scores actually increased (toward more positive mood) from T1 to T2 in the low depressive symptom group following the negative MIP, negative mood scores increased in the group who were higher on depressive symptoms. This task may be of particular utility in that it simulates the types of negative affect (i.e., performance-induced stress) which may commonly be experienced by college students. The small sample size for this study represents a significant limitation, as it resulted in low statistical power and limited our ability to examine finer grained effects, such as differential effects of the PASAT-C on mood by gender or ethnicity. Future work will need to replicate these findings with larger and more diverse samples. References Lejuez, C. W., Kahler, C. W., & Brown, R.A. (2003). A modified computer version of the Paced Auditory Serial Addition Task (PASAT) as a laboratory-based stressor. Behavior Therapist. 26(4), 290-293. Orme, J. G, Reis, J. & Herz, E. J. (1986). Factorial and discriminant validity of the Center for Epidemiological Studies Depression (CES-D) scale. Journal of Clinical Psychology. 42(1), 28-33. Russell, J. A., Weiss, A., & Mendelsohn, G. A. (1989). Affect Grid: A single-item scale of pleasure and arousal. Journal of Personality and Social Psychology. 57(3), 493-502. Watson, D., Clark, L. A., & Tellegen, A. (1988). Development and validation of brief measures of Positive and Negative Affect: The PANAS scales. Journal of Personality and Social Psychology. 54(6), 1063-1070. This work was supported in part by a grant from the National Institute on Alcohol Abuse and Alcoholism to Dr. Jennifer Read (R03AA014261). • I n t r o d u c t i o n • Analogue tasks that effectively elicit negative affect will facilitate laboratory examination of negative mood and related factors. Recent research suggests that the Paced Auditory Serial Addition Task (PASAT) may be used to induce negative mood in laboratory paradigms (Lejuez et al., 2003). The purpose of the present study was to assess the efficacy of a modified PASAT (PASAT-C) to induce negative mood in a sample of college students. Additionally, the present study examined whether reactivity to this mood induction varied by levels of baseline depressive symptomatology. • M e t h o d • Participants • Participants (N=42, 12 males) were regularly drinking college students at a mid-sized university in the Northeastern United States. Participants varied in age from 18-24 years. The mean age was just over 20 years old (see Table 1 below). The majority (n=37, 88.1%) of participants were White. Approximately three-quarters of the participants (n=33, 78.5%) reported being upperclassmen. • Measures • Affect Grid • Four dimensional measure (arousal and valence) • Valence dimension (unpleasant – pleasant) used in present analyses • Measures present affective state at time of administration (i.e. “right now”) • Indicted by placing an ”X” in single box of corresponding affect • Assesses range of feelings at present time. • Scores range from 1 (unpleasant) to 9 (pleasant) Method (Cont’) Positive and Negative Affect Schedule (PANAS; Watson et al., 1988). - Two dimensional measure - 20 items assess positive (10 items) and negative (10 items) affect - Indication of affect at present time (i.e., “right now”) - Continuously rated on Likert-type scale; range 1-5 Center for Epidemiological Studies-Depression Scale (CES-D; Orme et al. 1986). -22 items to assess depressive symptomatology - Items rated separately on Likert-type scale (0-3) depending on frequency of symptom occurrence - Higher scores indicative of greater depression - Coefficient alpha = .78 Procedure One-hour experimental sessions were conducted individually. Participants were required to complete self-report questionnaires and a series of computerized tasks. At the beginning of each session, baseline self report assessments of mood were administered. Following baseline assessment of mood, participants were randomly assigned to complete a modified version of the computerized PASAT (PASAT-C; Lejuez et al 2003) designed to induce a stressed mood, or to a timed arithmetic task designed to elicit a neutral mood. The PASAT-C stressor task required participants to view a series of numbers sequentially on a computer monitor and to add the two most recently viewed numbers at increasing speeds thus inducing psychological stress. Participants also were given bogus “normative feedback” regarding their performance in order to increase their level of distress. Following the induction task, participants were then re-administered the two state mood measures. Informed consent was obtained at the beginning of each experimental session. Analytic strategy Separate analyses of covariance (ANCOVA) with the PANAS and Affect Grid measures were conducted to assess the efficacy of the PASAT-C in eliciting negative mood. Scores on the CES-D were included in the models as an independent variable to examine the influence of baseline depressive symptomatology on mood outcomes. Baseline (pre-mood induction) mood was the covariate in these analyses. In exploratory analyses, we examined patterns of effect of mood induction paradigm (MIP) by high and low CES-D scores. Results PASAT Mood Manipulation PANAS Outcomes. Results of the ANCOVA with PANAS as the dependent variable revealed a significant main effect for mood condition, F(1,34)=5.3, p<.05, with those in the negative mood condition reporting higher levels of general negative mood on the PANAS mood subscale after controlling for baseline negative mood (see Figure 1 below). We found no main effect for depressive symptoms (CES-D) on mood outcomes. Affect Grid Outcomes. ANCOVA results with the Affect Grid as the dependent variable, though only marginally significant, yielded similar findings to those of with the PANAS as a dependent variable. Those assigned to the PASAT-C negative mood manipulation reported greater negatively-valenced affect post MIP than those in the neutral condition, F(1,35)=3.5, p=.07 (see Figure 2). In these analyses, we also found a significant main effect for CES-D scores, F(1,35) =5.0, p<.05. Though sample size prohibited sufficient statistical power to examine interaction effects, we examined differences in Affect Grid scores by MIP condition based on a median split of CES-D scores to explore patterns of effects. These are presented in Figure 3.