Download
1 / 47
470 likes | 619 Vues
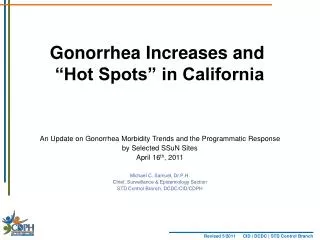
Gonorrhea Increases and “Hot Spots” in California. An Update on Gonorrhea Morbidity Trends and the Programmatic Response by Selected SSuN Sites April 16 th , 2011 Michael C. Samuel, Dr.P.H. Chief, Surveillance & Epidemiology Section STD Control Branch, DCDC/CID/CDPH. Outline.

E N D
Gonorrhea Increases and “Hot Spots” in California An Update on Gonorrhea Morbidity Trends and the Programmatic Response by Selected SSuN Sites April 16th, 2011 Michael C. Samuel, Dr.P.H. Chief, Surveillance & Epidemiology Section STD Control Branch, DCDC/CID/CDPH
Outline Gonorrhea Trends Why Might GC be Increasing? Hot Spots Actions
GonorrheaCalifornia Rates, 1913–2009 United States
Gonorrhea, Rates by Gender California, 1990–2009 Male Female
Gonorrhea, Rates by GenderCalifornia, 2006–2010, by Quarter Male 23% 17% Female 24% 21% 2nd half 2009 to 2nd half 2010 Increase: Male = 20% Female = 23% Total = 21%
Gonorrhea Cases by Gender and Sexual OrientationCalifornia CGSS/SSuN Data, 2007-2010 by Half-Year Interval(excludes San Francisco) Females MSM Heterosexual Males
Percent Increase by Race/Ethnicity & SexGonorrhea, California, 2nd Half 2009 to 2nd Half 2010 N cases 2nd Half of 2010 = Note: approximately 30% of case reports are missing race/ethnicity data
Percent Increase by Age Group & SexGonorrhea, California, 2nd Half 2009 to 2nd Half 2010 N cases 2nd Half of 2010 =
Why is GC Increasing? • Real • Changes in sexual networks • Changes in associated risk behaviors • Reduced access to care • Treatment failure / antibiotic resistance • Other changes in organism (e.g. virulence) • Artifactual • Increased reporting (or decreased in prior period) • Increased testing/screening
CGSS/SSuN Risk Factor Data2nd Halves 2009 and 2010 * N for factor may be slightly smaller due to missing data
Behavioral Risk Factors among Age 18-45 by Gender California, BRFS 2008 vs 2010 MALES FEMALES *Percents weighted to age and race of 2000 California population
Another “Why”: Unemployment Reduced access to care Sexual behavior change (?) In California, unemployment 12.5% in 2nd half of 2010, from 11.9% in 2nd half of 2009 High 2010 unemployment rate in some “increase hot spots” (Fresno=16.9%) and some “disparities hot spots” (Kern=15.3%, San Bernardino=14.2%)
Gonorrhea test volume by gender and half-year, Family PACT 2007-2010
Gonorrhea, Rates by Gender and Race/Ethnicity California, 2009 Note: Race/Ethnicity was “Not Specified” for 32.8% of female cases and 30.9% of male cases for the given year.
Ranking Gonorrhea Cases by Census Tract to Identify Hot Spots, 2009
Gonorrhea TOTAL Cases, SACRAMENTO, 2009 (Southwest detail zoom)
Racial Disparities Data, How to Use the Data, Why and What to do about it: http://www.cdph.ca.gov/data/statistics/Documents/STD-Racial-Disparities-Slides.ppt http://www.cdph.ca.gov/programs/std/Documents/ Presenting-on-STD-Racial-Disparities-FAQ-Guide-08.pdf
Data Quality • Improve completeness of race/ethnicity reporting in core surveillance data • Disseminate biannual automated performance measure reports for all California counties: includes percent complete race/ethnicity • Review best practices of high performing Counties
Data Dissemination for Local Action Disseminated detailed data and maps to “Hot Spot” Health Departments Multiple meetings/presentations with community groups in “Hot Spot” jurisdictions (Alameda, San Bernardino, and Sacramento)
Rapid Detection (and Control?) of Cephalosporin Resistant GC Local expansion of Gonococcal Isolate Surveillance Project for real-time testing and case/partner follow-up of alert values (via local lab testing)
Provider Visits and Education for Providers in Hot Spot Counties • Epi team developed lists of providers seeing large numbers of cases in Hot Spot counties • Provider Education (e.g. regarding case/partner management, reporting, etc.) • DIS provider visits • Free on site clinical trainings in collaborating with the California HIV/STD Training Center
Expand GC Screening and Treatment • CA STD Screening Recommendations include: • Risk factors for CT or GC in women over age 25, include “…African American women up to age 30…” • One “Hot Spot” County initiated testing all African American Clients <= 30 years of age at county clinic • MSM STD CheckUp.org • Expanded Clinical Access Project (ECAP): enable more sites to expand screening and treatment through public health pricing • Expand LA County’s “I Know” campaign to Bay Area GC Hot Spot counties • State will create web interfaces, assist with setting up lab, and provide start-up funding
There’s No Place Like Home:L.A. County’s I Know Home Test Kit Program for CT and GC Targeting Young Women of Color DontThinkKnow.org Website
The “I Know” Home Test Kit Program: Key Features • Available to any woman in LAC age 12-25; kit and test 100% free to client • All materials in English and Spanish • Order kit online or by phone • Easy access test results online or by phone • Order confirmation, results-ready notice by user-selected options • For positives, immediate link to clinic options by ZIP, printable referral form • Treatment follow-up for all positives through STDP Nursing • Intended to complement, not displace, clinic testing
Case and Partner Management • DIS planned GC case follow-up in • Hot Spot census tracts • Repeat GC infections in Hot Spot counties • DIS field work • Case interviews • Assure proper treatment • Prevention education • Partner elicitation; partner follow-up • Field treatment if indicated • GC Expedited Partner Therapy (EPT) • Revising guidelines • IPP funded CT & GC “partner packs”
Thanks California Team! Let’s Talk: Stopping Computer Viruses Michael C. Samuel, Dr.P.H. Michael.Samuel@cdph.ca.gov 510.620.3198
Extra Slides For Q&A If needed
Hot Spots counties based on concentration of African American GC Cases
MSM Gonorrhea Cases by Anatomic SiteWeighted Data – Excluding SF2007-2010, by Quarter
Gonorrhea test Positivity by gender and half-year, Family PACT clients tested by Quest 2007-2010 12% 26%
Gonorrhea, Total Cases, California (excluding SF & LA), 2009
Gonorrhea, BLACK Cases, California (excluding SF & LA), 2009
DontThinkKnow.orgSummary of 1st Year: June 8, 2009 – June 7, 2010 • Total visits to website: 30,878 • Unique visitors: 25,774 • Total specimen orders 2,927 • Submitted specimens 1,619 • Testable specimens 1,543 • Chlamydia detected 122 (7.9%) • Gonorrhea detected 15 (1.0%) • Treated cases 115 (88%)* *Out of 131 positive individuals
Second District Gonorrhea Control Plan A Six Component Approach Case Management Expanded Screening School Level Programs GC Control & Prevention Social Marketing Public Relations Community Engagement