Thermal Processes
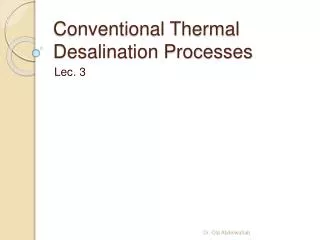
Thermal Processes. ENVI 1400 : Lecture 6. Radiation Processes. reflected solar radiation 107 W m 2. Incoming solar radiation 342 W m 2. Outgoing longwave radiation 235 W m 2. 40. Reflected by clouds, aerosol & atmosphere. 30. 165. 77. emitted by atmosphere. Absorbed by atmosphere.

Thermal Processes
E N D
Presentation Transcript
Thermal Processes ENVI 1400 : Lecture 6
Radiation Processes reflected solar radiation 107 W m2 Incoming solar radiation 342 W m2 Outgoing longwave radiation 235 W m2 40 Reflected by clouds, aerosol & atmosphere 30 165 77 emitted by atmosphere Absorbed by atmosphere 67 78 350 24 back radiation 324 Reflected by surface 40 30 324 78 390 168 24 thermals Absorbed by surface Evapo-transpiration Absorbed by surface Surface radiation ENVI 1400 : Meteorology and Forecasting
An adiabatic process is one in which no energy enters or leaves the system. Many atmospheric processes are adiabatic (or nearly so) – particularly those involving the vertical movement of air. Air is a poor thermal conductor, and mixing often slow enough for a body of air to retain its identity distinct from the surrounding air during ascent. Near-surface processes are frequently non-adiabatic. Adiabatic Processes: Ascent of convective plumes Large scale lifting/subsidence Condensation/evaporation within an airmass Non-Adiabatic Processes: Radiative heating/cooling Surface heating/cooling Loss of water through precipitation Addition of water from evaporation of precipitation falling from above Adiabatic Processes ENVI 1400 : Meteorology and Forecasting
Lapse Rate is the term given to the vertical gradient of temperature. The fall in temperature with altitude of dry air that results from the decrease in pressure is called the Dry Adiabatic Lapse Rate = -9.8°C/km. Lapse Rate Dry Adiabatic Lapse Rate Altitude 1km 9.8°C Temperature ENVI 1400 : Meteorology and Forecasting
Condensation releases latent heat, thus saturated air cools less with altitude than dry air. There is no single value for the saturated adiabatic lapse rate. It increases as temperature decreases, from as low as 4°C/km for very warm, tropical air, up to 9°C/km at -40°C. Altitude Dry Adiabatic Lapse Rate Saturated AdiabaticLapse Rate Temperature ENVI 1400 : Meteorology and Forecasting
A column of air has pressure levels P1, P2, etc. If the column is warmed, the air will expand and it’s density at any given level decrease. The vertical interval between pressure levels increases, so that at any given altitude the pressure in the warmer column is greater than in the cooler. N.B. since the total mass of air in the column is constant, the pressure at the surface does not change P5 P4 P3 P2 P1 P0 warm Pressure & Temperature P5 P4 P3 P2 P1 P0 z cool ENVI 1400 : Meteorology and Forecasting
Cold-core Low intensifies with height Warm-core High intensifies with height H L L H warm warm cool cool cool warm Warm-core Low weakens with height, may form a high aloft cold-core High weakens with height, may form a low aloft H L H L cool cool warm warm warm cool ENVI 1400 : Meteorology and Forecasting
Mid-latitude low-pressure cells have colder air to the rear. As a result, the axis of the low slopes towards the colder air Cold low L Warm high Sea-level isobars 500 mb contours ENVI 1400 : Meteorology and Forecasting
High pressure cells slope towards the warmest air aloft. The centre of the cell at 3000m may be displaced 10-15° towards the equator. Cold low H Warm high Sea-level isobars 500 mb contours ENVI 1400 : Meteorology and Forecasting
Thermal lows result from the strong contrast in surface heating between land and sea Land heats up (solar radiation) and cools down (infra-red radiation) much more rapidly than ocean large diurnal cycle cross-coast temperature gradient N.B. A thermal low results from fine, clear, warm weather, and thus differs from the depressions associated with cloud and bad weather. The Thermal Low ENVI 1400 : Meteorology and Forecasting
H cool cool warm 1. Start with a horizontally uniform pressure distribution.Solar radiation starts to warm land. Air near surface is warmed by land, convection mixes warm air upwards and whole boundary layer warms. 2. Air over land warms and expands. Can’t expand sideways, so column expand upwards produces high pressure aloft.N.B. Surface pressure remains constant at this stage. ENVI 1400 : Meteorology and Forecasting
H L cool cool warm 3. Horizontal pressure gradient aloft drives a flow from over land to over ocean. H cool cool warm 4. Mass of air in column over land is reduced surface pressure falls to produce a surface low. High pressure aloft weakens, but is maintained by continued heating at surface.Surface pressure gradient drives flow from sea to land: the sea breeze. ENVI 1400 : Meteorology and Forecasting
L H warm cool warm 5. When solar heating stops, pressure driven flows act to equalize pressure, restoring conditions to the initial uniform pressure field. If land cools sufficiently at night, the reverse situation can be established. Over large land masses there may be insufficient time over night for the sea breeze to reach regions far from the coast, and a weak surface low is maintained over night. This then deepens during the following days, and a heat low may be maintained for days or weeks, until synoptic conditions change. H L ENVI 1400 : Meteorology and Forecasting
Sea Breeze • Formation of local thermal low over land, results in the formation of a sea-breeze • In-flowing cool air from sea forms a sea-breeze front – a miniature cold front • Air ahead of the front is forced upward, contributing to the formation of cumulus. 950 mb 975 mb 1000 mb 25C 15C ENVI 1400 : Meteorology and Forecasting
Because the depth of a layer of air increases as its temperature increases, we can use the difference in altitude between two constant pressure levels as an indicator of the mean temperature of the layer. Charts are usually produced of the depth of the layer between 1000 and 500 mb. The layer depth is usually quoted in deca-metres (10s of metres) A useful rule of thumb is that for 1000-500 mb layer depths less than 528 dm (5280 m) any precipitation will fall as snow rather than rain. Pressure as an indicator of temperature ENVI 1400 : Meteorology and Forecasting
528 546 564 SLP (mb) & 1000-500 thickness : 48hr forecast valid 0000 040922 ENVI 1400 : Meteorology and Forecasting
546 528 564 SLP (mb) & 1000-500 thickness (dm) : 36hr forecast valid 0000 040930 ENVI 1400 : Meteorology and Forecasting
546 564 SLP (mb) & 1000-500 thickness (dm) : analysis valid 0000 040930 ENVI 1400 : Meteorology and Forecasting
546 2°C 564 12°C 850 mb Temperature (2°C contours), RH (%), wind (m s-1) : analysis valid 0000 040930 ENVI 1400 : Meteorology and Forecasting
546 564 Surface temperature (2°C contours) and SLP (mb)(5mb contours) : analysis valid 0600 040930 ENVI 1400 : Meteorology and Forecasting
It is commonly observed that clouds at different altitudes move in different directions winds are in different directions. The gradient of wind velocity (speed & direction) is called the (vertical) wind shear. In the free air, away from surface (where friction effects complicate matters), the wind shear depends upon the temperature structure of the air. The thermal wind is a theoretical wind component equal to the difference between the actual wind at two different altitudes. Any two levels can be used, but unless otherwise stated the altitudes of the 1000mb and 500mb levels are usually used. Note that the 1000mb level might be below sea level, and is usually within the boundary layer and thus influenced by friction effects at the surface. The Thermal Wind ENVI 1400 : Meteorology and Forecasting
cold LOW warm 500mb HIGH Vg(1000) LOW 996 1000mb HIGH 1004 1008 ENVI 1400 : Meteorology and Forecasting
500-1000 mb thickness 5580 5640 5700 LOW VG1000 5640 5700 VT LOW VG500 0 5760 Contours of 500 mb surface 60 5820 HIGH 120 Contours of 1000 mb surface HIGH 180 ENVI 1400 : Meteorology and Forecasting
Note that cold air is to the left of the thermal wind vector (looking along wind) in the northern hemisphere, to the right in the southern hemisphere. The decrease in temperature towards the poles results in a westerly thermal wind in the upper atmosphere in both hemispheres. The largest meridional temperature gradient occurs in mid-latitudes across the polar front. The thermal wind makes up a significant component of the jet-stream, located over the upper part of the polar front. ENVI 1400 : Meteorology and Forecasting