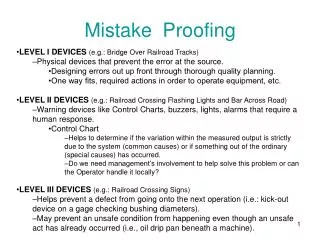

Error-Proofing Techniques: Enhancing Quality and Efficiency in Processes
E N D
Presentation Transcript
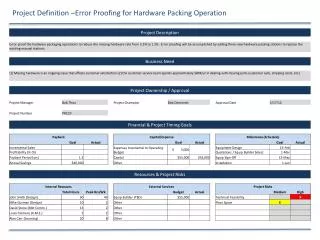
DESCRIPTION OF PROCESS: BEFORE IMPROVEMENT: AFTER IMPROVEMENT: ERROR PROOFING IMPLEMENTATION FORM PROCESS: PREVENT ERROR: PROBLEM: DETECT ERROR: SOLUTION: FOLLOW-UP PERSON:_________________________________ DATE:________________
1. COST OF QUALITY: A measure of the costs incurred to produce a quality product. May include both value added and non-value added components. Although the Cost of Quality is usually stated as a percentage of total sales, it may be easier to establish cost of quality in terms of dollars or a percentage of production. COST OF QUALITY is equal to or consists of: 1. Cost of prevention, plus 2. Cost of appraisal, plus 3. Cost of internal failures, plus 4. Cost of external failures PREVENTION = Quality planning, quality training, quality system controls and maintaining process capability studies, etc. APPRAISAL = Any audits, 100% inspection, 100% testing. INTERNAL FAILURES = Scrap, rework, sorting, quarantined inventory, engineering permits / deviations. EXTERNAL FAILURES = Returned sales, warranty, premium freight, customer charges. How to calculate: Cost of Quality - Use the best available measure, such as scrap rate or dollars. Note: The maximum reduction allowed is 100%. 2. FIRST TIME QUALITY: The net quantity of parts that are acceptable at the end of a process, divided by the original quantity started into the process, expressed as percentage; i.e., the accepted parts yield rate. It does not give credit for the results of rework, scrap, etc. How to calculate: Note: This percentage can be greater than 100%. ( Current State - Improved State ) Current State X 100 Percentage Reduction = Conforming Throughput Total Throughput First Time Quality = ( Improved State - Current State ) Current State Percentage Improvement = X 100 QUALITY WORKSHOPDEFINITION OF QUALITY MEASURES - SHEET 1
3. PROCESS CAPABILITY: A measure of the capability of a process to produce a product • within specifications. The 6 sigma range of process’s inherent variation, for statistically stable • processes only. The measure is expresses as Ppk or Cpk. The performance index, Ppk, is • recommended for workshop use, given the time constraints of the workshop. • How to calculate: • Process Capability: • Ppk = The performance index, typically defined as the minimum of or • Cpk = The capability index for a stable process, typically defined as the minimum of • or • Note: This percentage can be greater than 100%. • Example: Current Index = 1.0 • Improved Index = 1.3 • % Change = .3 1 X 100 = 30% • 4. OVERALL QUALITY MEASUREMENT: A quality measure as viewed from the end • customer’s perspective. Typically based on the percentage of non-conforming products. • Examples are: • PPM Reduction • Relative Variation Reduction • Defects per Unit Reduction • How to calculate: • Note: The maximum reduction allowed is 100%. = = X-LSL USL-X ^ ^ 3 3 s s = = (X-LSL) (USL -X) _ ^ _ ^ 3 3 R/d R/d 2 2 ( Improved State - Current State ) Current State Percentage Improvement = X 100 . _ . ( Current State - Improved State ) Current State Percentage Reduction = X 100 QUALITY WORKSHOPDEFINITION OF QUALITY MEASURES - SHEET 2