
38°
38°. google: cisn shakemap nc http://www.cisn.org/shakemap/nc/shake/. 37.5°. 37°. 123°. 122°. 121°. The Next Bay Area Earthquake. What to expect. What is the Hazard in San Jose?. Dr. John Boatwright, Bay Area Earthquake Alliance Co-Chair

38°
E N D
Presentation Transcript
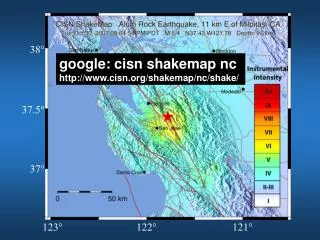
38° google: cisn shakemap nc http://www.cisn.org/shakemap/nc/shake/ 37.5° 37° 123° 122° 121°
The Next Bay Area Earthquake What to expect What is the Hazard in San Jose? Dr. John Boatwright, Bay Area Earthquake Alliance Co-Chair Co-Regional Coordinator for Northern California US Geological Survey
North American Plate E-A SF Bay Area Greater LA Pacific Plate California urban areas are prisoners of the Plate Boundary
7 9 24 7 5 9 6 17 2 15 40 mm/yr Farallons-Sierra Nevada North American plate Pacific plate
Hayward Earthquake 1868 “We need to correct our style of architecture … to work a savings of untold sums of money in the future” - San Jose Mercury NewsOctober 29, 1868
San Francisco 1906
Loma Prieta 1989
Bay Area Earthquake History 1600-2000 A.D.
Moment Accumulation in the SF Bay Region Cumulative M0, dyne-cm Stress Shadow
In the next 30 years there is a 63%prob- ability, nearly a 2/3rds chance, of an M6.7 or larger earthquake in the greater Bay Area. Hazard ishighest in the East Baydue to the larger number of faults there, including the Hayward fault. (UCERF2 Report, 2007) 3% 1% 3% 31% 21% 11% 63% 7% 6% 2007-2036
M ≥ 6.7 Hazard ishighest in the East Bay due to the larger number of faults including the Hayward Fault.
1868 Hayward Earthquake this ShakeMap is based on damage reports- there were only 260,000 people in the Bay Area 38° the shaking was strongest in San Leandro and Hayward -121.5° -121°
Animation of Shaking from a M7.0 on the Hayward Fault San Leandro Epicenter http://earthquake.usgs.gov/regional/nca/simulations/hayward/
Losses by county - M7.0 scenario Sonoma Solano Santa Clara Santa Mateo San Francisco Marin Contra Costa Alameda $0 $40B $80 $100 Economic Loss ($Billions) 16
What will happen in the next large earthquake? Soft-Story Damage & Failures Fire Following Earthquake
Soft-Story Buildings soft-story retrofits in San Francisco are still voluntary rather than mandatory 18
1989 Favorable Fire Conditions caused by soft-story failure