Download
1 / 28
280 likes | 425 Vues
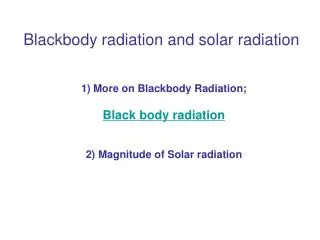
Solar radiation budget and the maximum UHI levels of the Metropolitan area. Tahsina Islam No Mentor. UHI. Urban heat island: Comparison of non-urban and urban temperatures Absolute value: Urban temperature (minus) rural temperature (equals) urban heat island Compared: spacial scales

E N D
Solar radiation budget and the maximum UHI levels of the Metropolitan area Tahsina Islam No Mentor
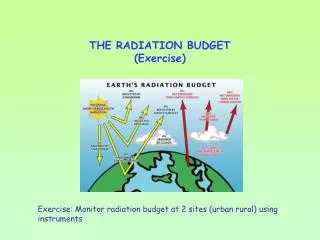
UHI Urban heat island: Comparison of non-urban and urban temperatures Absolute value: Urban temperature (minus) rural temperature (equals) urban heat island Compared: spacial scales times scales radiometric scales maps of surface temperature from remote sensing shows direct comparison between urban and non-urban areas
Variations in New York city’s urban heat island strength over time and spaceS. R. Gaffin1, C. Rosenzweig1, R. Khanbilvardi2, L. Parshall1, S. Mahani2, H. Glickman2, R. Goldberg1, R. Blake3, R. B. Slosberg4, D. Hillel1
Quantifying the influence of land-use and surface characteristics on spatial variability in the urban heat islandMelissa A. Hart & David J. Sailor Portland, Oregon Vehicle temperature traverses were used to determine spatial differences in summertime air temperature across the metropolitan area in the afternoon.
Assessment of the Urban Heat Island in Casa Grande, Arizona Brent C. Hedquist, Department of Geography, Arizona State University • Early studies : T(u-r) (difference between background rural and highest urban temperatures) is directly related to city size (Oke 1973). • For North American and European settlements, the following equation illustrates how a prediction of the maximum heat island, or T(u-r)(max), can be made by taking the log of the population (p):
The optimal equation, which explains the most variance in the maximum heat island and includes average wind speed is:
Materials and Mathods • 4 day period • March 15 – 18 2004 • Fixed Station versus 9 areas chosen by researchers • Fixed Station Asos III – National Weather Service Station
SOLAR RADIATION AND URBAN HEAT ISLANDSWERNER H. TERJUNG AND STELLA S-F. LOUIE top of one building (w1), continues down the side of that building h1, crosses the street d, ascends the side of the second building h., and terminates on the top of the latter we
Research Proposal Problem: What would be the maximum UHI levels of 5 stations in the metropolitan area? In these areas what would be the radiation budget compared to Manhattan? Hypothesis: The maximum UHI levels would correlate with the previous UHI levels taken. Manhattan's radiation budget would be much less as the buildings are so much taller
8 suburban areas approximately100 km away from Central Park in NYC • HOBO RH/Temperature Sensors in each location – variable proof • Average of all 8 areas- control group • Each Metropolitan area – experimental groups • Control Group: Manhattan radiation budget • Experimental Group: 5 areas selected outside of Manhatten
Results Variable taken into consideration: Trees add to the amount of shade and lessen radiation budget
Results: Maximum UHI Max UHI will correlate with the UHI levels of previous research of each station Not much difference occurs in UHI from 2002 record Ocean Parkway would have highest max UHI W 56th ST would have lowest max UHI
Discussion UHI is important in understanding NYC’s climate change Contributes to PLANYC 2030 : Climate Change goals being reached Knowing how NYC ranks amongst other cities around the world Evaluate how much NYC is contributing to global warming
Citations Oke, T.R., 1981. Canyon geometry and the nocturnal UHI: comparison of scale model and field observations. Journal of Climatology, 1 (1–4), 237–254. Santamouris, M., et al., 2001. On the impact of urban climate on the energy consumption of buildings. Solar Energy,70 (3), 210–216. Williamson, T.J. and Erell, E., 2001. Thermal performance simulation and the urban microclimate: measurements andprediction. In: Proceedings of 7th IBPSA. Rio de Janeiro, Brazil: International Building Performance Simulation Association, 159–166. Hedquist, Brent C. "Assessment of the Urban Heat Island in Casa Grande, Arizona." Journal of the Arizona-Nevada Academy of Science 38.1 (2005): 29-39. JSTOR. Web. 20 June 2010. <http://www.jstor.org/stable/27641736>. Terjung, Werner H., and Stella S-F Louie. "Solar Radiation and Urban Heat Islands." Annals of the Association of American Geographers 63.2 (1973): 181-207. JSTOR. Web. 20 June 2010. <http://www.jstor.org/stable/2562269>.