Surplus (a.k.a. excess supply):
220 likes | 238 Vues
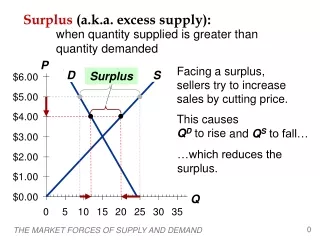
Surplus (a.k.a. excess supply):. P. Surplus. S. D. Q. 0. when quantity supplied is greater than quantity demanded. Facing a surplus, sellers try to increase sales by cutting price. This causes Q D to rise. and Q S to fall…. …which reduces the surplus.

Surplus (a.k.a. excess supply):
E N D
Presentation Transcript
Surplus (a.k.a. excess supply): P Surplus S D Q 0 when quantity supplied is greater than quantity demanded Facing a surplus, sellers try to increase sales by cutting price. This causes QD to rise and QS to fall… …which reduces the surplus. THE MARKET FORCES OF SUPPLY AND DEMAND
Surplus (a.k.a. excess supply): P S D Q 0 when quantity supplied is greater than quantity demanded Facing a surplus, sellers try to increase sales by cutting price. Surplus This causes QD to rise and QS to fall. Prices continue to fall until market reaches equilibrium. THE MARKET FORCES OF SUPPLY AND DEMAND
Shortage (a.k.a. excess demand): P S D Q 0 when quantity demanded is greater than quantity supplied Example: If P = $1, thenQD = 21 lattes andQS = 5 lattes resulting in a shortage of 16 lattes Shortage THE MARKET FORCES OF SUPPLY AND DEMAND
Shortage (a.k.a. excess demand): P S D Shortage Q 0 when quantity demanded is greater than quantity supplied Facing a shortage, sellers raise the price, causing QD to fall and QS to rise, …which reduces the shortage. THE MARKET FORCES OF SUPPLY AND DEMAND
Shortage (a.k.a. excess demand): P S D Q 0 when quantity demanded is greater than quantity supplied Facing a shortage, sellers raise the price, causing QD to fall and QS to rise. Prices continue to rise until market reaches equilibrium. Shortage THE MARKET FORCES OF SUPPLY AND DEMAND
Three Steps to Analyzing Changes in Eq’m To determine the effects of any event, 1.Decide whether event shifts S curve, D curve, or both. 2.Decide in which direction curve shifts. 3.Use supply-demand diagram to see how the shift changes eq’m P and Q. THE MARKET FORCES OF SUPPLY AND DEMAND
EXAMPLE: The Market for Hybrid Cars P price of hybrid cars S1 P1 D1 Q Q1 quantity of hybrid cars THE MARKET FORCES OF SUPPLY AND DEMAND
EXAMPLE 1: A Shift in Demand EVENT TO BE ANALYZED: Increase in price of gas. P S1 P2 P1 D2 D1 Q Q1 Q2 STEP 1: D curve shifts because price of gas affects demand for hybrids. S curve does not shift, because price of gas does not affect cost of producing hybrids. STEP 2: D shifts rightbecause high gas price makes hybrids more attractive relative to other cars. STEP 3: The shift causes an increase in price and quantity of hybrid cars. THE MARKET FORCES OF SUPPLY AND DEMAND
EXAMPLE 1: A Shift in Demand P S1 P1 D2 D1 Q Q1 Notice: When P rises, producers supply a larger quantity of hybrids, even though the S curve has not shifted. P2 Always be careful to distinguish b/w a shift in a curve and a movement along the curve. Q2 THE MARKET FORCES OF SUPPLY AND DEMAND
Terms for Shift vs. Movement Along Curve Change in supply: a shift in the S curve occurs when a non-price determinant of supply changes (like technology or costs) Change in the quantity supplied:a movement along a fixed S curve occurs when P changes Change in demand: a shift in the D curve occurs when a non-price determinant of demand changes (like income or # of buyers) Change in the quantity demanded:a movement along a fixed D curve occurs when P changes 9
EXAMPLE 2: A Shift in Supply EVENT: New technology reduces cost of producing hybrid cars. P S1 S2 P1 P2 D1 Q Q1 Q2 STEP 1: S curve shifts because event affects cost of production. D curve does not shift, because production technology is not one of the factors that affect demand. STEP 2: S shifts rightbecause event reduces cost, makes production more profitable at any given price. STEP 3: The shift causes price to fall and quantity to rise. THE MARKET FORCES OF SUPPLY AND DEMAND
EXAMPLE 3: A Shift in Both Supply and Demand EVENTS:price of gas rises AND new technology reduces production costs P S1 S2 P2 P1 D2 D1 Q Q1 Q2 STEP 1: Both curves shift. STEP 2: Both shift to the right. STEP 3: Q rises, but effect on P is ambiguous: If demand increases more than supply, P rises. THE MARKET FORCES OF SUPPLY AND DEMAND
EXAMPLE 3: A Shift in Both Supply and Demand STEP 3, cont. P S1 S2 P1 P2 D2 D1 Q Q1 Q2 EVENTS:price of gas rises AND new technology reduces production costs But if supply increases more than demand, P falls. THE MARKET FORCES OF SUPPLY AND DEMAND
A C T I V E L E A R N I N G 3Shifts in supply and demand Use the three-step method to analyze the effects of each event on the equilibrium price and quantity of music downloads. Event A: A fall in the price of CDs Event B: Sellers of music downloads negotiate a reduction in the royalties they must pay for each song they sell. Event C: Events A and B both occur. 13
P S1 P1 P2 D2 D1 Q Q1 Q2 A C T I V E L E A R N I N G 3A. Fall in price of CDs The market for music downloads STEPS 1. D curve shifts 2. D shifts left 3. P and Q both fall. 14
P S1 S2 P1 P2 D1 Q Q1 Q2 A C T I V E L E A R N I N G 3B. Fall in cost of royalties The market for music downloads STEPS 1. S curve shifts (Royalties are part of sellers’ costs) 2. S shifts right 3. P falls, Q rises. 15
A C T I V E L E A R N I N G 3C. Fall in price of CDs and fall in cost of royalties STEPS 1. Both curves shift (see parts A & B). 2. D shifts left, S shifts right. 3. P unambiguously falls. Effect on Q is ambiguous: The fall in demand reduces Q, the increase in supply increases Q. 16
CONCLUSION: How Prices Allocate Resources One of the Ten Principles from Chapter 1:Markets are usually a good way to organize economic activity. • In market economies, prices adjust to balance supply and demand. These equilibrium prices are the signals that guide economic decisions and thereby allocate scarce resources. THE MARKET FORCES OF SUPPLY AND DEMAND
CHAPTER SUMMARY • A competitive market has many buyers and sellers, each of whom has little or no influence on the market price. • Economists use the supply and demand model to analyze competitive markets. • The downward-sloping demand curve reflects the Law of Demand, which states that the quantity buyers demand of a good depends negatively on the good’s price. 18
CHAPTER SUMMARY • Besides price, demand depends on buyers’ incomes, tastes, expectations, the prices of substitutes and complements, and number of buyers. If one of these factors changes, the D curve shifts. • The upward-sloping supply curve reflects the Law of Supply, which states that the quantity sellers supply depends positively on the good’s price. • Other determinants of supply include input prices, technology, expectations, and the # of sellers. Changes in these factors shift the S curve. 19
CHAPTER SUMMARY • The intersection of S and D curves determines the market equilibrium. At the equilibrium price, quantity supplied equals quantity demanded. • If the market price is above equilibrium, a surplus results, which causes the price to fall. If the market price is below equilibrium, a shortage results, causing the price to rise. 20
CHAPTER SUMMARY • We can use the supply-demand diagram to analyze the effects of any event on a market:First, determine whether the event shifts one or both curves. Second, determine the direction of the shifts. Third, compare the new equilibrium to the initial one. • In market economies, prices are the signals that guide economic decisions and allocate scarce resources. 21