Download
1 / 1
10 likes | 118 Vues
Methodology. Nike One Platinum 336 Dimples Smooth N=10 N=11. TitlelistPro V1x 336 Dimples Smooth N=10 N=10. Calloway Big Bertha 336 Dimples Hexx N=10 N=12. Precept Laddie 392 Dimples Steep N=10 N=14. Nike TA2-LNG 392 Dimples Steep N=10 N=10. Titlelist N-X-T

E N D
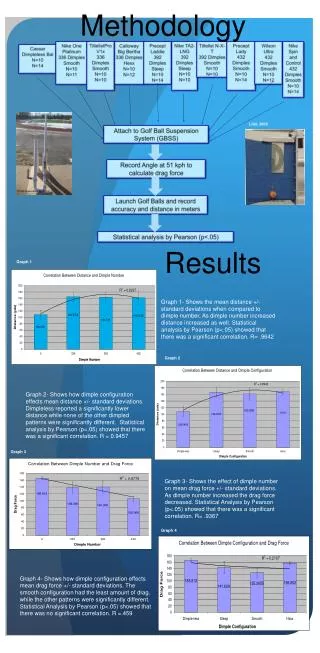
Methodology Nike One Platinum 336 Dimples Smooth N=10 N=11 TitlelistPro V1x 336 Dimples Smooth N=10 N=10 Calloway Big Bertha 336 Dimples Hexx N=10 N=12 Precept Laddie 392 Dimples Steep N=10 N=14 Nike TA2-LNG 392 Dimples Steep N=10 N=10 Titlelist N-X-T 392 Dimples Smooth N=10 N=10 Precept Lady 432 Dimples Smooth N=10 N=14 Wilson Ultra 432 Dimples Smooth N=10 N=12 Nike Spin and Control 432 Dimples Smooth N=10 N=14 Caesar Dimpleless Bal N=10 N=14 Libii, 2005 Attach to Golf Ball Suspension System (GBSS) Record Angle at 51 kph to calculate drag force Photo Generated by Author Launch Golf Balls and record accuracy and distance in meters http://eng.monash.edu.au/uicee/worldtransactions/WordTransAbstractsVol5No3/23_NjockLibii15.pdf Statistical analysis by Pearson (p<.05) Results Graph 1 Graph 1- Shows the mean distance +/- standard deviations when compared to dimple number. As dimple number increased distance increased as well. Statistical analysis by Pearson (p<.05) showed that there was a significant correlation. R= .9642 Graph 2 Graph 2- Shows how dimple configuration effects mean distance +/- standard deviations. Dimpleless reported a significantly lower distance while none of the other dimpled patterns were significantly different. Statistical analysis by Pearson (p<.05) showed that there was a significant correlation. R = 0.9457 Graph 3 Graph 3- Shows the effect of dimple number on mean drag force +/- standard deviations. As dimple number increased the drag force decreased. Statistical Analysis by Pearson (p<.05) showed that there was a significant correlation. R= .9367 Graph 4 Graph 4- Shows how dimple configuration effects mean drag force +/- standard deviations. The smooth configuration had the least amount of drag, while the other patterns were significantly different. Statistical Analysis by Pearson (p<.05) showed that there was no significant correlation. R =.459