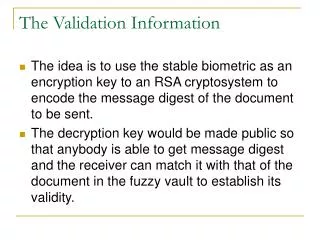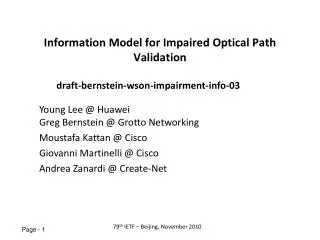
Validation Information for DNS Solutions
250 likes | 382 Vues
Validation Information for DNS Solutions. Joe Werne Colorado Research Associates Division NorthWest Research Associates, Inc. 3380 Mitchell Lane Boulder, CO 80301 werne@cora.nwra.com 303-415-9701 x 207 26 September 2005. Universal Symbols. = Experiment. = Simulation.

Validation Information for DNS Solutions
E N D
Presentation Transcript
Validation Information for DNS Solutions Joe Werne Colorado Research Associates Division NorthWest Research Associates, Inc. 3380 Mitchell Lane Boulder, CO 80301 werne@cora.nwra.com 303-415-9701 x 207 26 September 2005
Universal Symbols = Experiment = Simulation
Chen, Kelley, Gibson-Wilde, Werne & Beland, Annales Geophysicae, 2001 Wind shear: Balloon Comparison
Mixing Layers through the Troposphere and Stratosphere Coulman, Vernin & Fuchs, Applied Optics34 5461 (1995) CT2 Ri T
120 m Ierkic, Woodman & Perillat, Radio Science25, 941 (1990) Radar Backscatter Re ~ 106-107
U.S. Air Force anemometry data Bruce Masson, 1996 also, Michael Roggeman, private communication, 2001
Fort Collins Photo Colorado Springs, Colorado, 2000 (photo by Tye Parzybok)
Denver Photo Denver, Colorado, 1953 (photo by Paul E. Branstine)
Estes Park, 1979 Estes Park, Colorado, 1979 (photo by Bob Perney)
Joe’s Back Yard Lafayette, Colorado, 2002 (photo by Joe Werne)
Viscous & Thermal Dissipation Kelvin-Helmholtz DNS computed solutions
CT2 = 3.3 ε-1/3 χ l0 = 7.4 lK Exponent between 2/5 and 2/3 Systematic dependence in x. 2nd-order structure-function fits CT2 fits from DNS Werne & Fritts, 2000
CU2 = 2.1 ε2/3 l0 = 11.3 lK l0 = 8.0 lK Exponent between 2/5 and 2/3 We have also computed structure-function fits for V and W, but until recently data were not available. Wroblewski, Cote, Hacker, Crawford, 2002 2nd-order structure-function fits CU2 fits from DNS Werne & Fritts, 2000
2nd-order structure-function fits Comparison with Egrett Werne & Fritts, 2000 Wroblewski, Cote, Hacker, Crawford, 2002 CU2, CV2, CW2, CT2, exponents, inner scale all consistent with measurements. z, altitude (km) CV2/CU2 CW2/CU2 CU2/CT2 CW2/CT2
Kelvin-Helmholtz: Balloon Comparison Peak-to-midlayer ratios Chen, Kelley, Gibson-Wilde, Werne & Beland, Annales Geophysicae, 2001
z time time T Structure Function Fits Werne, Meyer, Bizon & Fritts, 2002 x y CT2 fits, continuous in time a CT2 lo
Coulman, Vernin & Fuchs, Applied Optics34 5461 (1995) CT2 Ri T Combine Simulation and Observation for an operational path
Coulman, Vernin & Fuchs, Applied Optics34 5461 (1995) CT2 Ri T Combine Simulation and Observation for an operational path
Coulman, Vernin & Fuchs, Applied Optics34 5461 (1995) CT2 Ri T Combine Simulation and Observation for an operational path
Coulman, Vernin & Fuchs, Applied Optics34 5461 (1995) CT2 Ri T Combine Simulation and Observation for an operational path
Coulman, Vernin & Fuchs, Applied Optics34 5461 (1995) CT2 Ri T Combine Simulation and Observation for an operational path
Coulman, Vernin & Fuchs, Applied Optics34 5461 (1995) CT2 Ri T Combine Simulation and Observation for an operational path
Conclusions 1. Stratification restricts mixing dynamics to vertically confined regions. 2. Entrainment zones maintain sharp thermal gradients that dominate optical effects. 3. Mixing in the interior of turbulent layers reduces thermal gradients. 4. Mixing zones in wind-shear simulations duplicate morphology exhibited by cloud observations. 5. Potential-temperature profiles, duration, CT2 profiles, and Ri profiles agree with balloon measurements. 6. Turbulence constants Cθ and C (relating χ and Є to CT2 and CU2) and CV2/CU2 and CW2/CU2 obtained from comparison with the middle of a simulated shear layer agree with atmospheric measurements, as do the spectral slope and inner scale. 7. Entrainment zones are non-stationary, inhomogeneous, and anisotropic; unfortunately they also have the greatest impact on optical propagation. 8. Dynamic SGS is promising for stable stratification, but systematic dependence on filter width limits generality of method. 9. Improved modeling is required for further progress with LES. This is in progress.