Download
1 / 24
250 likes | 356 Vues
INTERNATIONAL ECONOMICS Free Trade & Protectionism-Graphical Analysis. IB HL2 Economics-January 20111. FREE TRADE EXAMPLE

E N D
INTERNATIONAL ECONOMICSFree Trade & Protectionism-Graphical Analysis IB HL2 Economics-January 20111
FREE TRADE EXAMPLE This graph shows a situation where free trade is taking place in a country where wheat is both produced domestically and internationally. If there was no foreign trade, then domestic farmers would produce 0Qe tons of wheat at a price of Peper ton. If we now assume the market is open and foreign trade takes place, then the situation changes. Consumers find they can import wheat at the world price. If they are prepared to pay the world price, they can import as much wheat as they like. This means the supply curve faced by importers S (World) is perfectly elastic. S (World) must be below Pe or there would be not point in trading. With free trade, the price of wheat in the country will be S (World). At this price, domestic farmers will only be prepared to supply 0Q1 tons of wheat. However, the demand for wheat will be 0Q2 and so the excess demand is satisfied by imported wheat. Foreign producers will supply Q1 to Q2 tons of wheat. Thus domestic consumers get to consume QeQ 2 more wheat at a lower price.
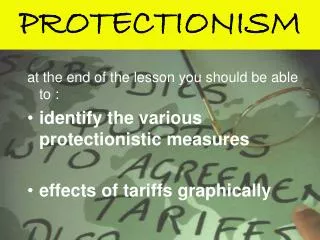
Tariffs • A tariff is a tax that is charged on imported goods. • As we know from microeconomics, any tax placed upon a good shifts the supply curve upwards by the amount of the tax • In the case of a tariff, it will shift the world supply curve upwards, since it is placed on the foreign producers of the good and not the domestic producers.
THE EFFECT OF A TARIFF ON IMPORTED WHEAT Before the tariff, 0Q2 tons of wheat were being consumed at a price of pw. Domestic production was 0Q1 and imports were Q1Q2. When the tariff is imposed S (World) shifts up by the amount of tariff to S (World) + tariff and so the market price rises to Pw + T. Total quantity demanded falls from 0Q2 to 0Q4 because the price has risen. Domestic producers increase production to 0Q3 and so their revenue increases from g to g + a + b + c + h. Foreigner producers supply the rest, which is now Q3 to Q4. They receive Pw + T, but they have to pay the tariff to the government. Thus their revenue falls from h+i+j+k to only i+j. The government now receives tariff revenue of d+e.
Tariffs & PricesWheat Example • The importers must pay a higher price for the imported good. • In the case of wheat, the price will be passed on to millers and eventually to cereal companies or bakeries that buy the refined wheat.
Tariffs & PricesCar Industry Example • If the government introduced a tariff on car component parts, then this would raise the cost to car-makers and eventually lead consumers to have to pay higher prices for their cars. • If the car maker is an exporter, then the higher cost of imported components could reduces its international competitiveness.
Tariffs & Anti-Dumping Measures • Tariffs are the most common type of anti-dumping measure. • If a country has able to prove that dumping has taken place, then it can place a tariff on the imported goods to raise their prices and eliminate the cost advantages of the dumped imports.
DEAD WEIGHT LOSS OF WELFARE: Explanation 1 Q4Q2 tons of wheat are no longer demanded. Consumers keep the amount of money k, that they would have spent on the wheat. As a consequence there is a loss of consumer surplus equivalent to f, because the wheat is not purchased. This is known as a dead-weight loss of welfare, because of the loss of consumer surplus.
DEAD WEIGHT LOSS OF WELFARE: Explanation 2 After the tariff, Q1Q3 tons of wheat are now produced by relatively inefficient domestic farmers, as opposed to more efficient foreign farmers. The foreign farmers would produce this quantity for minimum reserve of h, whereas the domestic farmers need a minimum revenue of h+c. Thus c represents the inefficiency of the domestic producers and a loss of world efficiency, since more of the world resources are being used to produce the wheat than are necessary. This is another dead weight loss of welfare.
Subsidies • A Subsidy is an amount of money paid by the government to a firm, per unit of output. • In the case of protectionist policies, the government is giving a subsidy to domestic producers to make them more competitive. • The effect of this policy will be to shift the domestic supply curve downwards by the amount of the subsidy
SUBSIDY ON DOMESTIC WHEAT PRODUCTION Before the subsidy, 0Q2 tons of wheat were being consumed at a price of Pw. Domestic production was 0Q1 and imports Q1Q2. When the subsidy is granted, S (Domestic) shifts downwards by the amount of the subsidy to S (Domestic) + subsidy. The market prices stays at Pw and so demand remains at 0Q2 However, domestic producers increase production to 0Q3 because they are now receiving Pw + subsidy per unit they produce. This means that their revenue increases from a to a+b+e+f+g. Foreign producers now supply the rest which is now Q3 to Q2. Thus their revenue falls from b+c+d to only c+d. The government pays the subsidy which is shown by the area e+f+g in total.
SUBSIDY ON DOMESTIC WHEAT PRODUCTION Dead-weight loss of welfare As with a tariff, Q1Q3 tons of wheat are produced by relatively inefficient domestic farmers, as opposed to more efficient foreign farmers. The foreign farmers would produce this quantity for a minimum revenue of b, whereas the domestic producers need minimum revenues of b+g. Thus g represents the inefficiency of domestic producers and misallocation of the world’s resources since more of the world’s resources are being used to produce the wheat than are necessary. This another dead weight loss of welfare.
There is No Loss of Consumer Surplus with Tariffs and Subsidies • There is no loss of consumer surplus because the price of wheat does not change. • However, consumers are indirectly affected as governments will use tax revenue to fund the subsidies. • This may mean higher tax payments and also involves an opportunity costs in terms of reduced government spending on other things.
Quotas • A quota is a physical limit on the numbers or values of goods that can be imported into a country. • For example, the EU imposes import quotas on Chinese garlic and mushrooms. • The imposition of a quota has peculiar effect on the free trade diagram.
QUOTAS Before the quota is imposed 0Q2 of wheat is purchased at price of pw. Domestic supply is 0Q1 and imports are Q1Q2. Let us now assume that the government imposes a quota of Q1-Q3 tons of wheat. Domestic producers supply 0Q1 at a price of Pw and the importers produce their quota of Q1-Q3. However, once this has happened there is an excess of demand of Q3-Q2 at the price of Pw and so price begins to rise. As the price rises, importers are not allowed to supply more wheat, because they have filled their quota. S (Domestic) S (Domestic + Quota S (World) Domestic producers begin to enter the market, attracted by the higher price of wheat. The domestic supply curve has, in effect, shifted to the right, above Pw. Eventually the price settles at price settles at Pquota, where demand now equals supply again and the total quantity of wheat demanded falls to Q4. Domestic producers now supply 0Q1 and Q3-Q4 tons of wheat at a price of PQuota. Their revenue rises from a to a + c + d + f +i + j. Foreign producers now supply their quota of Q1Q3 and also receive a price of Pquota. Thus their income changes from b+c+d+e to b+g+h.
QUOTAS – DEAD-WEIGHT LOSS OF WELFARE Q4Q2 tons of wheat are now demanded. Consumers keep the amount e they would have spent on the wheat, but there is a loss of consumer surplus equivalent to k, because the wheat is not now purchased. This is a dead-weight loss of welfare, because of the loss of consumer surplus S (Domestic) S (Domestic + Quota S (World) After the quota, Q3Q4, tons of wheat are now produced by relatively inefficient domestic farmers, as opposed to more efficient foreign farmers. The foreign farmers would produce the quantity for a minimum revenue of c+d whereas the domestic producers need a minimum revenue of c+d+j. Thus j represents the inefficiency of the domestic producer and a loss of world efficiency, since more of the world’s resources are being used to produce the wheat than are necessary. This is another dead-weight loss of welfare.
Voluntary Export Restraints (VERs) • Voluntary export restraints are agreements between exporting and importing countries in which the exporting country agrees to limit the quantity of exports of specific good below a certain level. • This is usually to avoid the imposition of legal restrictions by the importing country. • The agreement may be reached at either industry or government level. • For example, China has agreed to limit its export of textiles to South Africa.
Administrative Barriers • When goods are being imported, there are usually administrative processes that have to be undertaken. • This may known as a “red tape”. • If these processes are lengthy and complicated, then they can act as a restriction to imports. • For example, making importers go through complicated paperwork, before they can get their goods into the country will slow down imports.
Administrative Barriers • If the paperwork requires a large amount of legal work, then it will slow the process down even more and raise the cost to the importer. • Sometimes countries may designate certain ports of entry that are difficult to reach and also more expensive. • This may cause border delays and again raise costs.
Health, Safety, & Environmental Standards • This is where various restrictions are placed upon the types of goods that can be sold in the domestic market or on the methods used in the manufacture of certain goods. • These regulations will apply to imports and may restrict their entry. • While it is important that countries are able to guarantee the health and safety of their population, it important that government are legitimately keeping out unsafe imports, rather than simply protecting their own country’s workers.
Health, Safety, & Environmental Standards Challenges for Developing Countries • While the maintenance of product standards is extremely important, developing country exporters may find it is difficult or prohibitively expensive to carry out the necessary certification to prove that they meet the international standards. • The costs involved in certification may make if difficult for such countries to successfully exploit their comparative advantage.
Embargos • In effect, an embargo is an extreme quota. • It is complete ban on imports and is usually put in place as form of political punishment. • For example, the US has a trade embargo on all products from Cuba. • Complete embargoes are rare.
Economic Sanctions • Countries may put in place a set of economic sanctions against an offending country. • Unlike an embargo, these limit the exports or imports of one or a few key products and are also used as a form of political punishment or to achieve a desired political objective.
Nationalistic Campaigns • Governments will sometimes run marketing campaigns to encourage people to buy domestic goods instead of foreign ones in order to generate more demand for domestic goods and preserve domestic jobs. • Such campaigns have happened in countries, such as the UK, Australia and the US. • This may be described as “moral suasion” where the government links consumption of imported goods to the creation of unemployment.