Download
1 / 47
470 likes | 692 Vues
Optimal Performance Symposium November 2009 Tim Montgomery - The Service Level Group. Tim has honed his expertise by working closely with and advising some of the world’s most recognized service organizations. Gallup – Why Employees Leave?

E N D
Optimal Performance Symposium November 2009 Tim Montgomery - The Service Level Group
Tim has honed his expertise by working closely with and advising some of the world’s most recognized service organizations
Gallup – Why Employees Leave? Lack of MANAGEMENT support in areas such as performance and development. No faith in LEADERSHIP or vision of the company. Concern with MANAGEMENT’s treating of people.
“I do what is required of me – nothing more” “This is a temporary position for me - just buying my time” “The managers just don’t get it – we see what’s really happening everyday”
“This is a wonderful place to work – feel proud to be an employee” “My focus is making the customer I’m talking with happy”“I’m part of improving customer service every day”
“World Class is NOT something you deliver, it is a RESULT of something you are”John DiJulius
Adherence Talk Time Attitude FCR Sick Bathroom Time Hold Time Recommendations Wrap Time Accuracy
Quality • The resulting score on the monitoring form • Team and group comparisons of the score • Number of audits completed
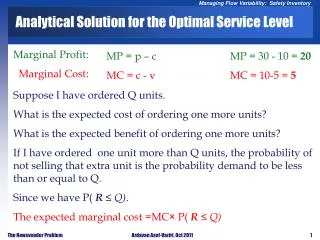
Productivity/Adherence • How much time is focused on customer work? • A number, goal, or range • Encouraging and rewarding better results
Call Volume 250,000 350 Seconds Handle Time 265 FTEs
Call Volume 250,000 320 Seconds Handle Time 240 FTEs
Call Volume 225,000 350 Seconds Handle Time 235 FTEs
Call Volume 225,000 320 Seconds Handle Time 215 FTEs
Measurement Traps Focused on Self Looking Backwards FAITH in Numbers Gaming the Metrics Sticking TOO LongHBR Oct 2009
Internal Measures Not Connected with the Customer or Competition Why does the customer care?
Quality • Was it right and do I feel comfortable? • Do I feel valued? • Did I get everything I needed?
Productivity/Adherence • How much time was taken from me? • Did I feel rushed? • Was someone available when I wanted?
Too Much Time Spent Analyzing the Score More Time On the Game Film and Moving Players
Outliers from the Norm Personal Best Behaviors from Metrics Coaching beyond QA …Buy-In and Easy Talk Time Quality Adherence
Measures Put In Place Because Everyone Else Does It Understand That Size Makes Call Centers Different
Measures With Holes That Lead to Excuses “Wishful Thinking and Denial” …Look Beyond the 4 Walls
GATEWAY - I Built This Company, I Can Save It – Fortune Magazine Many of these changes hurt more than just morale. They hurt business. For example, one policy put a time limit on customer-service calls; reps who spent more than 13 minutes talking to a customer didn't get their monthly bonuses. As a result, workers began doing just about anything to get customers off the phone: pretending the line wasn't working, hanging up, or often -- at great expense -- sending them new parts or computers. Not surprisingly, Gateway's customer satisfaction rates, once the best in the industry, fell below average. What's more, many customers stopped recommending Gateway to their friends and families; Gateway's referral business -- once 50% of total sales -- fell to about 30%
Comparing Apples to Watermelons and the resulting AVERAGE Give leaders the tools to COACH the solution
79% 89%
Agent Empowerment Limited by the Numbers Outline the Behaviors First, Then the Drivers
Quality Monitoring Becomes a Numbers Game Connect Quality to Improvement the Entire Process
Ongoing Internal and External Process Changes,but Static Goals Leaders That Can Coach to the Exceptions and Change
USAA - Positioning Supervisors for Success with a Call Center Curriculum (From CC Management Review) “Many times, supervisors are promoted from within; we select the best agent to be the next supervisor. They are the leaders of your customer service staff and the “voice” of your company – but have you equipped them with more than a Stephen Covey book? Invest in the future of your company by giving new and upcoming supervisors a thorough understanding of how to run an effective and efficient call center – from communication skills to Erlang C.”
Agents Can’t Make the Connection to the Why Educate Everything About the Driver and the Real Results
Spend a lot of Time “Cleaning-Up” After Others Get Everyone Excited About First Contact Resolution
Reliance on After Call Coding for Front-line Feedback Engage Them to Help Fix the Process – and Reward Them
Quality • Scores don’t change behaviors • Trends indicate opportunities • Goal is to improve service not manage agents
Productivity/Adherence • Without the reality, the planning process is flawed • Indicators of opportunities to coach new behaviors • Fluid – changes with the processes