Opportunities, challenges and implications for policy
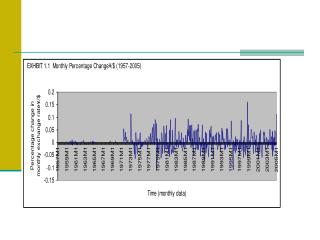
Opportunities, challenges and implications for policy. Martin Parkinson Secretary to the Treasury 17 May 2011. Chart 1: Australian fiscal consolidations. Source: Treasury. Chart 2: Australian dollar against selected TWI currencies (12 month-ended percentage change). Source: Bloomberg.

Opportunities, challenges and implications for policy
E N D
Presentation Transcript
Opportunities, challenges and implications for policy Martin Parkinson Secretary to the Treasury 17 May 2011
Chart 1: Australian fiscal consolidations Source: Treasury.
Chart 2: Australian dollar against selected TWI currencies(12 month-ended percentage change) Source: Bloomberg.
Chart 3: Budget forecast errors on nominal non-farm GDP growth and taxation revenue growth (excluding GST) Source: Treasury.
Chart 4: Differences in nominal GDP estimates Source: ABS and Treasury estimates.
Chart 5: Differences in expected tax receipts Source: ABS and Treasury estimates.
Chart 6: Stock of capital losses as share of GDP Source: Australian Taxation Office.
Chart 7: Net tourism and the exchange rate Source: ABS Catalogue Number 3401.0 and RBA.
Chart 8: Trade weighted index exchange rate Source: ABS Catalogue Number 5302.0 and Treasury.
Chart 9: Ratio of company tax to corporate GOS – Mining versus non-mining Source: ABS and Treasury estimates.
Chart 10: Depreciation expenses as a proportion of corporate GOS – Mining versus whole of economy Source: ABS and Treasury estimates.
Chart 11: Terms of trade Source: ABS Catalogue Number 5206.0 and Treasury.
Chart 12: Employment share by activity G7 Australia Services Agriculture Industry Source: Feinstein (1999), OECD Statistics and Treasury.
Chart 13: Productivity – growth cycle analysis(Market sector 12 selected industries) Source: ABS Catalogue Number 5206.0 and Treasury.
Opportunities, challenges and implications for policy Martin Parkinson Secretary to the Treasury 17 May 2011