Download
1 / 54
560 likes | 697 Vues
This course provides a detailed guide to analyzing Amplitude Versus Offset (AVO) and Amplitude Versus Angle (AVA) data, utilizing Gassman's equations to predict changes in amplitude accurately. Participants will learn how to manage well data, including time alignment using shot surveys, adjusting depth measurements, and selecting appropriate wavelet models. The course covers generating AVO/AVA synthetics, creating cross-sections, and applying correlations from density and sonic logs. By the end, attendees will understand how to interpret the results and optimize models for identifying hydrocarbons in subsurface formations.

E N D
Use gassman’s equations to predict velocity Objective accurately predict changes in amplitude
Open well (your fluid sub well)> save to another name : file > Save As
Display logs in time : View > Time Model (also make sure view depth mode is set to ft below KB) Zoom all
If you don’t have a check shot survey you can use an estimate of the near surface velocity 9KB elevation of working floor of the derrik. Time shift is calculated relative to this datum. To apply time shift> Edit > Time Alignment Generally callibrated using check shots. If not, then need replacement velocity. If not estimate from sonic If you don’t have checkshots > may have to estimate velocity from sonic log to get a default TWT time shift
TWT = (Start Sonic – KB Eleb)/(2xReplacement Velocity) Then insert Well curve
OK OK
To make visible click Log Scales from the Edit > Log Scales drop down Add 3000, 10,000 to the left and right log scales > OK File > Save
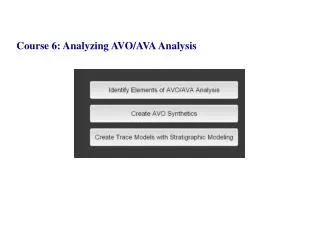
Select AVO/AVA Synthetics from the Synthetics drop down on the Well Editor Window
View > Aspect Ratio Not 1:1 Then View > Select Curves >
Turn off Formation Top Labels, CheckShots and plotting parameter buttons; Click on Data Area > Enter Start and End Times
AVO Gas Zoom in 0-4000 4000-8000 8000-12000
File > Save As Then close
AVO Synthetics – Oil Select your well > View > Time Model Synthetics > AVO/AVA Synthetics
Wavelets tab > define wavelet > OK Place synthetics File > Plot > Default Synthetic Layout View > Not 1:1 View > Select Curves
File > Plot Setup Remove checks from Formation Top Table CheckShot Table and Plotting Parameters Click on Data Area > Start and End Times OK > OK
Ready for Wet Open file> select your well> OK View > Time Mode Synthetics > AVO/AVA Synthetics Specify logs for wet case Insert into present log display
Modify layout File > plot > Default layout display Not 1:1 Rearrange View > Select Curves OK
Further customize File > Plot Setup Turn off Fm Tops, CheckShots, Plotting parameters Click on Data Area button Specify Start and End times OK > Plot Setup > OK to Exit
Lower amplitudes with water only suggests that the presence of hydrocarbons will produce an increase of amplitude with offset Close and File > Save As
Gas Oil Water
In the Model Builder Select Edit > Default Correlations Apply > Close Yes to default correlations will delete any existing correlations
Create Top and Base correlations Correlation must intersect sonic and density curves in each well Create horizontal T1 and Base correlations at top and bottom of cross section
Use correlation selector to select T1 Then click across the top of the log display
Select positions across the base of each log Zoom all Model > Create AVO/AVA model
Make sure stretch / squeeze is selected and then > Done Rename and enter # of traces > select Logs to Use Near Offsets
Use Repeat Traces > Select all wells > and specify repeat traces Add> OK
Specify Datum Elevation and Velocity Specify maximum offset and any other parameters; then Save Default > Generate Model Again, these should define the Near Offsets
Turn off plotting parameters and click OK to close the dialog Then save traces to SEGY
Now Far Offset trace model will be generated in the Model Builder Model > Create AVO/AVA model in the menu bar Leave everything the same accept for model name and max and min offsets (at base) > Generate Model
Model appears > File > Plot Setup Data Area Dialog change start and end times
Uncheck plotting parameters > OK Not 1:1
Resize the trace model windows and arrange next to each other for comparison File > Save model to SEGY
File > Save Model to SEGY option not shown in the on-line course drop down > Keep Clicking to get Output dialog Select a save file (far offset … Save > OK > File close all