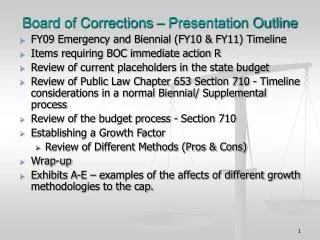
Board of Corrections – Presentation Outline
290 likes | 442 Vues
Board of Corrections – Presentation Outline. FY09 Emergency and Biennial (FY10 & FY11) Timeline Items requiring BOC immediate action R Review of current placeholders in the state budget

Board of Corrections – Presentation Outline
E N D
Presentation Transcript
Board of Corrections – Presentation Outline • FY09 Emergency and Biennial (FY10 & FY11) Timeline • Items requiring BOC immediate action R • Review of current placeholders in the state budget • Review of Public Law Chapter 653 Section 710 - Timeline considerations in a normal Biennial/ Supplemental process • Review of the budget process - Section 710 • Establishing a Growth Factor • Review of Different Methods (Pros & Cons) • Wrap-up • Exhibits A-E – examples of the affects of different growth methodologies to the cap.
FY09 Emergency and Biennial (FY10 & FY11) Timeline • September 1st budget submitted to Budget Office as required by law. • BOC budget placeholders currently in state budget system. • October 16th – Request for Decision - Deadline for all County Budget Submissions • October through November – One-on-Ones with DAFS and Governor • November through December – Governor’s Recommendations and Departmental Reviews • January 2009 – Budget to Legislature
Board of Corrections Immediate Action Items • Request all County Budgets by October 16th - Request • Establish County Growth Rates – October • Collection and review of County and MDOC Budget Data – Mid-October • BOC Review of Correctional Budgets and comparison to state budget placeholders – Mid-October • Current Budget Placeholders • FY09 Transition Reserve $1.5M • FY09 Debt Service Difference $959,698 • FY10 Growth Placeholder $ 4,762,026 • FY10 Community Corrections $5,646,562 • FY10 Debt Service Difference $2,958,481 • FY11 Growth Placeholder $ 8,122,768 • FY11 Debt Service Difference $2,306,632 • FY11 Community Corrections $5,646,562 • A $20,000 BOC Admin. Appropriation is already included in the BOC baseline.
Growth Factor - § 710 – Budget Timing § 710. County correctional services budget procedure #1 . . . 6 months before the beginning of each state fiscal year, . . . "the board," shall set a growth limitation for the correctional services expenditures in the new fiscal year for each county budget. Six months prior to the state fiscal year is January. The budget has to be submitted to the State Budget Office by September 1st by law four months prior. The BOC needs to establish growth factors by April 15th in order for the Counties to create a budget using the growth factor, allow time for review and input.
Normal Supplemental/ Biennial Budget Timeline (proposed) • By April 15th – the BOC sets growth rate. • April 15th through May 15th - Counties prepare correctional services budgets and submit budgets to the MDOC Service Center. • May 15th through May 22nd – the MDOC Service Center compiles County and MDOC budget information. • May 22nd through May 29th – the Budget Process Group will analyze the County Budgets and address any issues. • May 29th through June 5th – Budget Process Group presents budget information to the BOC Working Group Committee for review and to address any issues. • June 6th - The budgets are submitted to the BOC for review. • June 6th through August 15th – BOC reviews budgets, conducts interviews, addresses budget adjustments, conduct budget hearings as necessary, and adopt the budget. • August 15th – Budget is submitted to the MDOC Service center for input to the State Budget System. • September 1st – Budget submission deadline to the Budget Office as required by law.
§ 710 Budget Process Summary • If the county correctional services budget does not exceed the growth limitation the board must accept the county commissioners' approval of the county's correctional services budget. • If a county correctional services budget submitted to the board exceeds the growth limitation or is inconsistent with a directive of the board the board must further review the proposed budget together with any supplementary material prepared by the county commissioners, county correctional services administrators, the Department of Corrections or any other person or entity from whom the board chooses to receive supplementary material. • If the county correctional services budget submitted exceeds the growth limitation or is inconsistent with board directives, the board must further review, amend and adopt a correctional services budget for the county.
§ 710 Budget Process Summary (continued) • The board may hold a hearing under this subsection, except that it shall hold a hearing on a county correctional services budget when the county requests a hearing. If the board holds a hearing under this subsection, the provisions of Title 5, chapter 375, subchapter 4 apply. • Budget adjustment process. For a county correctional services budget submitted to the board, the board may amend or accept the proposed budget provided that the total estimated revenues, together with the amount of county tax to be levied equal the total estimated expenditures. • Adoption of budget. After review of a county correctional services budget submitted to the board under subsection 2, a hearing, if necessary pursuant to subsection 3, and the adjustment process under subsection 4, the board shall adopt a final correctional services budget for the county and transmit that budget to the county commissioners.
§ 710 Budget Process Summary (continued) • Assessment of taxes. • 2-A. Tax assessment for correctional services. The counties shall annually collect no more than $62,452,804(the cap) from municipalities for the provision of correctional services, excluding debt service, in accordance with this subsection. • 2-B. The countiesshall collect taxes from municipalities for the purpose of retiring the county jail debt in existence as of July 1, 2008 until the debt is finally retired.
Establishing a Growth Factor Please keep in mind the following analysis is relative to the cap and the information we have at this time. Many of the percentage distributions and factors used will change as the economy and Maine policy making changes. Growth factors will be set in two ways: • An overall correctional growth factor, and • Growth factors specific to each County.
Establishing a Growth Factor • In establishing a growth factor no one method is correct; several methods can be used. • Corrections population trends • Historical trends • County & MDOC Historical Trends • CPI(Consumer Price Indexes) • National – Regional - Commodity Specific • Political necessity • In establishing a correctional growth rate a blend of methods should be considered depending on the needs of corrections and the economic circumstances at that time.
Establishing a Growth Factor – Looking at Independent Methods The following methods in determining growth are independent of other methods. Various methods will be reviewed highlighting the Pros and Cons of each on their own merit.
Growth Factor – The Use of Blended Rates • Pros • Uses a variety of Indexes to establish a rate: • Types • CPI – National, Regional, Commodity Specific • Population • Historical Growth • Political Necessity • Allows flexibility in areas that may be affected more than others by market trends. • Represents actual market activity • Widely used index in projecting needs • Cons • May not meet specific needs of the State or each County. • Source data – User must understand what they are looking at and how to use it. See Exhibit A
Establishing a Growth Factor – Corrections Population Trends Year Over Year Population Growth
Growth Factor – Corrections Population Trends • Pros • Addresses variable component resulting from population changes in corrections. • Cons • Does not address fixed components of corrections: • Personnel • Infrastructure • Market Forces (fuel, food, electric) • On a percentage basis variable cost represents a significantly smaller portion of the cost of corrections as opposed to its fixed cost. See Exhibit B
Establishing a Growth Factor – Consumer Price Index National • The CPI(Consumer Price Index) is the most widely used measure of consumer price inflation. The CPI measures the average change over time in the prices paid by urban consumers for goods and services. The BLS(Bureau of Labor Statistics) of the US Department of Labor collects the CPI price information and calculates the CPI statistics. • CPI-U & CPI-W • CPI-U (All Urban Consumers) measures consumer price inflation for all U.S. Residents of urban areas, which accounts for about 87 percent of the U.S. population. • CPI-W (Urban Wage and Clerical Workers) measures consumer price inflation for a subset of the CPI-U population: residents of urban areas who live in households that: • Receive more than half of their income from clerical or wage occupations • Have one earner employed for at least 37 weeks during the previous 12 months. • CPI-W covers about 32 percent of the U.S. population
Growth Factor – National CPI-U, CPI-W • Pros • Addresses market changes as experienced by consumers. • Cons • Even though corrections is affected by market changes, CPI-U is a consumer based assessment. The needs of corrections may not mirror those of the market in general. • CPI is a composite average and does will temper volatile commodities such as food and fuel. • Labor market dynamics in Maine may also not mirror what is happening regionally or nationally. See Exhibit C
Pros Addresses market changes as experienced by consumers specific to New England. Statistics are specific by commodity. Closely mirror rates experienced by the state and corrections. Cons May not mirror the labor market dynamics in corrections. Will not address specific correction wide initiatives. Exhibit D Establishing a Growth Factor – CPI-U New England – Commodity Specific
Growth Factor – Corrections Historical Budget Trends • Pros • Shows historical performance • A good gauge of what may have worked and what didn’t • Cons • May perpetuate bad budgeting habits • Will not include new initiatives or visions • Funds may be misapplied and not used where most needed • Exhibit E
Establishing a Growth Factor – Political Necessity • Fuel prices, social needs, the upcoming presidential/ local elections and the general state of the economy are all factors that would be considered. • Limited resources and growing needs on tax revenue can cause shifts in resources to where they are most needed at a given time. • For example during the last Biennium the Department of Corrections was flat funded in All Other (Contractual and Commodities) and received no capital funding. • The current biennium anticipates a revenue shortfall of approximately $431M (as of August budget instructions).
Use a composite of Population Growth and State Planning CPI. In 2008 20% of correctional expenditures are variable, leaving 80% fixed. Using this assumption and applying population growth to 20% of the cap, and State Planning CPI to 80% of the cap would look as follows. This example is specific to this point in time only. Do not use this information as a general assumption. Establishing a Growth Factor – Mixing Factors
Establishing a Growth Factor – External Cost Drivers • Energy Market • Population Trends • Labor Market Dynamics • Recruitment & Retention • Food Costs • Programs • Medical Costs • Infrastructure – maintaining and new (certificate of need) • Building maintenance, vehicles and equipment
Establishing a Growth Factor – Wrap-up • A blended approach makes sense in establishing a growth factor. It will: • Allows vision and program needs to play a role. • Enable specific cost drivers to be addressed independently. • Provides consideration of other external costs driven by market influences, policy changes or necessity. • Includes the use of all methods of growth determination: historical trends, CPI, and population changes within corrections. • Provides flexibility and accuracy through options.
Exhibit AEstablishing a Growth Factor – Blended ApproachYear over Year (July 2007 vs. July 2008) • Personal Services – Use a composite (MDOC/ County) five year average • Fuel – seven month average of CPI-U-NE – 18.7% • Gas and Electric – CPI-U-NE - 12 month average– 10.41% • Food – CPI-U-NE – 12 month average – 4.88% • Medical – CPI-U-NE 12 month average– 3.62% • Other Contractual and Commodities – State Planning CPI – 2.10%
Population Growth as a Percentage against the Cap: Exhibit BEstablishing a Growth Factor – Corrections Population Trends
Population Growth using CPI-U from the State Planning Office Exhibit CEstablishing a Growth Factor – CPI National
CPI-U New England July ’07 to July ‘08 Fuel & Utilities – 36.79% Electricity – 10.41% Natural Gas – 26.22% Medical Care – 3.63% Food – 4.88% Partial Data Only. Represents a good portion of Correctional Overhead, but not all! Exhibit DEstablishing a Growth Factor – CPI-U MA, NH, ME, CT