Download
1 / 29
290 likes | 426 Vues
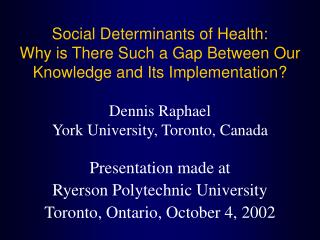
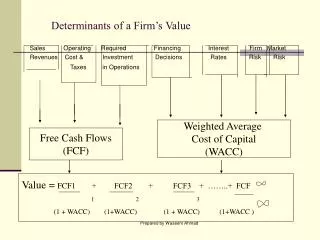
Determinants of a Firm’s Value. Sales Operating Required Financing Interest Firm Market Revenues Cost & Investment Decisions Rates Risk Risk Taxes in Operations. Weighted Average

E N D
Determinants of a Firm’s Value Sales Operating Required Financing Interest Firm Market Revenues Cost & Investment Decisions Rates Risk Risk Taxes in Operations Weighted Average Cost of Capital (WACC) Free Cash Flows (FCF) Value = FCF1 + FCF2 + FCF3 + ……..+ FCF 1 2 3 (1 + WACC) (1+WACC) (1 + WACC) (1+WACC ) Prepared by Waseem Ahmad
Financial Statements, Cash Flow and Taxes • Management`s Primary Goal is to maximize the value of Company`s Stock • Value depends upon the ability of the Company to generate stream of cash flows in the future. • Investor estimate future Cash Flow`s of Company by studying its annual report. • Annual report contains both Descriptive and Financial Information about the Company. • Descriptive section contains CEO report, Auditor report,Future plans, information about Company`s products etc. • Financial Portion contains FOUR basic Financial Statements ie., Balance Sheet, Income Statement, Cash Flow and Statement of retained earnings Plus last 10years key Financial results. Prepared by Waseem Ahmad
Financial Statements report what has actually happened to Assets, earnings, and dividends over the past year/s. Whereas, verbal statements explain why the things turned out the way they did. • The information contained in the Annual report is used by the investors to form expectations about the future earnings and dividends. Prepared by Waseem Ahmad
Balance Sheet • A Traditional Balance Sheet tells us the Financial position of a Company on a particular point in time. • Balance sheet equation is Assets = Liabilities + Owner`s Equity. Prepared by Waseem Ahmad
Assets 2004 2003 Cash &Eqvlts 10 15 Shrt Term Invst 0 65 Accounts Rcvbl 375 315 Inventories 615415 Ttl C/Assets 1000 810 Net Plant&Eqpt 1000 870 Total Assets 2000 1680 Liab&Equty 2004 2003 A/c Pybl 60 30 Note / Payable 110 60 Accruals 140130 Ttl C/Liablities 310 220 L.Term Bonds 754580 Total Debt 1064 800 P.Stock(400000) 40 40 C.Stock(50000000) 130 130 Retained Earnings 766710 Total Com Eqty 896840 Ttl Liab & Eqty 2000 1680 M/s Micro Drive Balance Sheet ($ in Mil)31 December 2003 / 2004 Prepared by Waseem Ahmad
Micro Drive IncIncome Statementfor the Year ending 31 Dec 03/04 (In Millions) 2004 2003 Net Sales3000 2850 Operating Cost Excldg Dep/Amtzn 2616.2 2497 Erng b4 Int,Tax,Dpcn&Amtzn(EBITDA) 383.8 353 Depreciation 100 90 Amortization 0 0 Depreciation &Amortization 100 90 Earning before Int&Tax (EBIT or Op Incm) 283.8 263 less interest 88 60 Earning before Tax (EBT) 195.8 203 Taxes @ 40 % 78.3 81.2 Net Income before Preferred dividend 117.5 121.8 Preferred Dividend 4 4 Net Income 113.5 117.8 Common Dividend 57.5 53 Additions to retained earnings 56 64.8 Prepared by Waseem Ahmad
Per Share Data 2004 2003 Common Stock Price 23 26 Earning per share (EPS) 2.27 2.36 Dividends per Share(DPS) 1.15 1.06 Book Value per share(BVPS) 17.92 16.80 Cash Flow per Share(CFPS) 4.27 4.16 EPS= Net Income / Comn Shares Outstanding 113,500,000/50,000,000= 2.27 DPS = Dividend Comn Stkholdrs/ Comn Sh/O 57,500,000/50,000,000 = 1.15 BVPS = Total ComEqty/Comn shares Outstdg 896,000,000 / 50,000,000= 17.92 Cash flow per share(CFPS) = Net Incm +Depreciation + Amortization / Common Share Outstading 213500000/ 50,000,000 = 4.27 Prepared by Waseem Ahmad
STATEMENT OF RETAINED EARNINGS Changes in retained earnings between balance sheet dates are reported in the Statement of Retained Earnings. Retained earnings represent`s a Claim against Assets. Retained earnings are used for Business Expansion purpose ie., investing in Assets . The retained earnings is not CASH nor available for payment of Dividends or any thing else Micro Drive Inc (Millions $) Retained Earning Statement for the year ending 31 Dec04 Balance of retained earnings , Decmeber 31, 2003 710 Add Net Income 2004 113.5 Less Dividends to common stock holders (57.5) Balance in retained earnings, December 31, 2004 766.0 Prepared by Waseem Ahmad
Cash Flow Statement Cash Flow Statement provides information about the cash receipts and cash payments of a business during the accounting period because of Operating, Investing and Financing activities. A Business’s Net Cash Flow is different from Accounting Profits Net Cash Flow = Net Income - Non Cash Revenues + Non cash Charges. Net Income: Other things held constant, Positive net income likely to result positive cash flow (Net Income can be used for Dividend payments, Increase in Inventories, Finance A/R, Investment in Fixed Assets, To reduce debts , To buy back common stock etc . Non cash Adjustment to net income: Non cash revenues and expenses are adjusted. Changes in Cash Balances : - Increase in current Assets other than CASH (Invt, A/R) decreases Cash and vice versa - Increase in Current Liabilities increases CASH and vice versa - Fixed Assets: Investment in fixed assets reduce cash and vice versa - Securities Transactions: If a Co issues Stock, Bonds during the year, the funds raised will increase Cash position, On the other hand if it ( uses cash ) buy back outstanding stock, pay off debt, dividends to share holders it will reduce the Cash . Prepared by Waseem Ahmad
Contents of Cash Flow Statement The Cash Flow statement separates activities into 3 categories plus a Summary section: 1. Operating Activities: Cash effects of revenue & expense transactions. Cash effect of those activities which are reported in Income Statement.(Net Income,Depreciation and changes in C/A & C/L other than Cash ,S/Term Investment, and Short term debt). Cash receipts: Collection from customers for sale of goods and services, Interest and Dividend received, Other receipts from operations eg., proceeds from settlement of litigation. Cash Payments: Payments to suppliers of Merchandise and Services, including payment to employees.Payment of interest, Payment of Income taxes, Other expenditure relating to operations eg., payment in settlement of litigation. Prepared by Waseem Ahmad
Investing Activities 2 Cash Flow relating to Investing Activities present the cash effects of transactions involving Plant Assets, Intangible Assets, and Investments (Investment in or Sale of Fixed Assets). Cash Receipts: Cash receipts from selling investments or plant assets, Cash Collection -- collecting principal amounts of loans-- (for banking co). Cash Payments: Payments to acquire investments or plant assets, Amount Advanced to Borrowers ( for banking co). Prepared by Waseem Ahmad
Financing Activities Financing Activities: It includes raising cash by selling short term investments or by issuing short term debt, long term debt, or stock. It also includes the impact of Dividend payment, cash used to buy back outstanding stock or bonds . Cash Receipts: Proceeds from sale of short term and long term borrowing, Cash received from Owners eg., from issuing stock. Cash Payments: Repayments of amount borrowed (excluding interest payments), Payments to owners such as dividends. Prepared by Waseem Ahmad
What questions Cash Flow statement tries to answer Financial Managers use this Cash Flow statement along with the Cash Budget when forecasting the Companies cash position. Cash flow statement answers the following questions: Is the Company generating ENOUGH cash to purchase additional assets which are required for growth. • Is the Company generating extra cash that can be used to repay debts or invested in new products. Profits reported in Income statements can be manipulated (doctored) whereas it is far more difficult to manipulate working capital simultaneously with profits. The Company can declare profits right up to the point of bankruptcy. Prepared by Waseem Ahmad
Micro Drive:Statement of Cash Flows for 2004 ($ in Mill) 1 Operating Activities Cash provided / Used Net Income b4 preferred dividend $ 117.5 Adjustments Non Cash Adjustments: Depreciation 100.0 Due to Change in Working Capital Increase in A / R (375-315) (60.0) Increase in Inventories (615-415) (200.0) Increase in A / Payables (60-30) 30.0 Increase in Accruals (140-130) 10.0 Net Cash provided by Operating Activities ($2.5) Prepared by Waseem Ahmad
2. Long term Investing Activities. Cash Used to acquire Fixed Assets(130+100) ($230) Total Funds used by Investing Activities ($230) 3 Financing Activities Sale of Short term Investment (65-0) $ 65.0 Increase in Notes Payables (110-60) 50.0 Increase in Bonds Outstanding (754-580) 174.0 Paymnt of Dvdnt (Comn 57.5+ Prefd 4) (61.5) Net Cash provided by Financing activities 227.5 SUMMARY: Net Changes in Cash ($5.0) Cash at beginning of the year 15 Cash at the End of the year $10 Prepared by Waseem Ahmad
MODIFYING A/CING DATA FOR MANAGERIAL DECISIONS Different Companies have different Financial Structures, Tax situations which can affect Return on Equity. 2 Companies having similar operations appear to be operating under different efficiency. Performance of Managers should be judged on the basis of their performance on the Operating assets which are under their control. (EBIT to be compared with Operating Assets) Assets can be classified as: Operating Assets: Those assets which are used for the core activities of the business. Non operating Assets: Used for Non core activities. Eg., Cash and short term investment held above level of normal operations. Prepared by Waseem Ahmad
Classification of operating assets: Operating Current Assets: Assets necessary to operate business eg., Inventories , Accounts receivables Long term operating Assets: Such as Plant and Equipment. Note: IF SAME AMOUNT OF PROFIT / CASH FLOW CAN BE GENERATED WITH LESS AMOUNT OF INVESTMENTS IN OPERATING ASSETS --- LESS CAPTIAL / FUNDS REQUIRED TO BE PROVIDED BY THE INVESTORS. IT WILL INCREASE RETURN ON CAPITAL AND LESSON COST OF CAPITAL. OPERATING CURRENT LIABILITIES Fund provided by the Normal Consequence of business are called operating Current Liabilities e.g., Accounts Payable, Accrued wages and Taxes etc . NOTE: THESE ARE FUNDS WHICH ARE NOT PROVIDED BY THE INVESTOR RATHER GENERATED AS A CONSEQUENCE OF BUSINESS OPERATIONS. Prepared by Waseem Ahmad
If a Company needs $100 millions of Assets but it has $10 millions of Accounts Payable and $ 10 millions of Accrued wages and Taxes then the Investor supplied capital would be only $ 80 millions. 100 - (10+10) = 80 Operating Working Capital: Current Assets used in operations are called Operating Working Capital. Net Operating Working Capital: Operating Working Capital less Operating Current Liabilities is called Net operating working capital. NOWC= All current Assets that do not pay interest MINUS All current liabilities that do not charge interest. Or NOWC= Operating Current Assets MINUS Operating Current Liabilities. Prepared by Waseem Ahmad
Cash , Inventories , Accounts receivable are required for Normal Business operations by all Companies. Any Short term security which a Company holds results from INVESTMENT decision I.e not required for Core activities. Current Liabilities that charge interest such as note payable to bank, are treated as investor supplied capital where as current asset Accounts payable / Accruals are as a result of normal business operation. NOWC= (Cash+ A/R+ Inventories ) -(A/P + Accruals) Total Operating Capital: (NOWC) + (Operating LT Assets) Prepared by Waseem Ahmad
NET OPERATING PROFIT AFTER TAXES (NOPAT) In order to calculate better measurement of the performance of the managers we compute NOPAT. This is amount of profit which a company will generate if it held no Debt and Financial Instrument. NOPAT = EBIT (1-Tax rate) For more complicated tax situations NOPAT = (Net income before preferred Dividend)+ (Net Interest expense ) (1-Tax rate) Prepared by Waseem Ahmad
FREE CASH FLOW NET CASH FLOW = NET INCOME + NON CSH ADJMT OPERATING CASH FLOW= NOPAT + DEPRECIATION FCF= The Cash flow actually available for distribution to Investors after the company has made all the investments in fixed assets and working capital necessary to sustain ongoing operations. In order to make company more valuable the managers should try to increase the amount of FCF FCF= Operating Cash Flw - G Investment in Oprting Assets. Or FCF = NOPAT - Net Investment in Operating Assets. Prepared by Waseem Ahmad
USES OF FCF Five Good Uses of FCF • Pay Interest to debt holders, keeping in mind that the net cost to the company is the after tax interest expense. • Repay debt holders that is pay off some of the debt • Pay dividends to share holders • Repurchase stock from the share holders • Buy marketable securities or other non operating asset. FCF is not used for acquiring operating assets FCF should not be used in unnecessary Investments which do not Add Value . FCF can also add in Agency Cost. FCF is the cash available for distribution to Investors. Therefore, the value of Company primarily dependent upon its expected future FCF. Prepared by Waseem Ahmad
EVALUATING FCF, NOPAT & OPTNG CAPITAL Negative FCF is not a sign of worry . Companies normally in expansion phase or High growth Co can have negative FCF. IF NOPAT as well as FCF both are negative than it is sign of WORRY. It means company is experiencing OPERATING problems. WHETHER the GROWTH is Profitable a measure ROIC is computed ( Return on Invested Capital). ROIC= NOPAT / OPERATING CAPITAL IF ROIC > WACC (If ROIC is greater than return investors demand ) The company is ADDING VALUE. Prepared by Waseem Ahmad
MVA and EVA Primary goal of Management is to Maximize share holder wealth.This will benefit Share holders and result in efficiently allocating funds in the economy. The share holder wealth is maximized by MAXIMIZING the difference between the market value of the stock and the amount of Equity Capital. It is called MARKET VALUE ADDED. MVA= MARKET VALUE OF STOCK MINUS EQUITY CAPITAL SUPLLIED BY SHARE HOLDERS. Or MVA=(Shares outstanding X stock price) Minus Total Common Equity. Prepared by Waseem Ahmad
The HIGHER the MVA the better the JOB management doing. THE MVA is some time defined the total market value of the company MINUS the total amount of investors supplied capital MKT Value of (Equity + Debt + Preferred stock) MINUS Total Common Equity + Debt+Preferred Stock. MVA Measures the effects of Managerial Actions since the Inception of the Company. EVA ECONOMIC VALUE ADDED EVA focuses on Management performance in a given year. EVA= NOPAT minus AFTER TAX $ COST OF CAPITAL USED TO SUPPORT OPERATIONS. Or EVA = EBIT(1-T) minus (Operating Capital) X (WACC) or EVA = (Operating Capital) x ( ROIC-WACC) Prepared by Waseem Ahmad
IF ROIC > WACC then Company will have +ve EVA • IF WACC > ROIC then new investment in OPERATING CAPITAL will reduce the firm VALUE. • EVA is an estimate of TRUE economic profit for the period and it differs SHARPLY from Accounting Profit. • EVA represents the Residual Income that remains after all the COST of CAPITAL , including Equity Capital has been deducted whereas Accounting profits are determined without consideration of equity capital cost. • IN EVA we do not add back Depreciation. • EVA measure the extent to which Company has added to the Share holders value. • EVA can be determined for all divisions as well as company as a Whole. It becomes the basis for evaluating performance of Management at ALL LEVELS. • IF a Company has history of NEGATIVE EVA then probably MVA will also be negative. Prepared by Waseem Ahmad
THE CO with Negative EVA can have Positive MVA provided INVESTORS expects a turnaround in future. EVA is used for evaluation of Management performance and management compensation. MVA Calculations: 2004 2003 Price per share 23 26 Number of Shares (Mill) 50 50 Market Value of Equity 1150 1300 Book Value of Equity 896 840 MVA added= Mkt Value minus Book Value 254 460 Prepared by Waseem Ahmad
EVA Calculation: 2004 2003 EBIT 283.8 263 Tax rate 40% 40% NOPAT=EBIT(1-T) 170.3 157.8 Total Invs Supplied Capital 1800 1455 After Tax cost of Capital 11% 10.8% (WACC) $ Cost of Capital = Capital 198 157.1 X (WACC) EVA=NOPAT-Capital Cost (27.7) 0.70 ROIC= NOPAT/ Optng Captial 9.46% 10.85 ROIC-Cost of Captl= ROIC-WACC (1.54%) 0.05% EVA= Optng Capital(ROIC-WACC) (27.7) 0.7 Prepared by Waseem Ahmad
How to compute Operating Capital Investor supplied operating capital equals the sum of note payable, Long term debt, preferred stock, and common equity, less short term investments. It could also be calculated as total liabilities and equity minus accounts payable, accruals and short term investments. It is also equal to total net operating capital. Yr 2004= NP 110, LTB 754, PRF STK 40 EQUITY 896 = 1800 YR2003 = 60 , 580, 40, 840 - 65 = 1455 OR FOR 2004 = 2000 - (60 + 140) = 1800 FOR 2003 = 1680 –(30+130+65) = 1455 Prepared by Waseem Ahmad