Download
1 / 14
140 likes | 253 Vues
Assessing SNO NCD Waveform Quality. Nikolai Tolich. Neutral Current Detectors. Array of 40 proportional counters deployed throughout the detector. These allow NC interactions to be identified on an event-by-event basis. PMT. NCD. 5 cm. n. 3 H. p. 3 He. Proportional counters.

E N D
Assessing SNO NCD Waveform Quality Nikolai Tolich
Neutral Current Detectors • Array of 40 proportional counters deployed throughout the detector. • These allow NC interactions to be identified on an event-by-event basis. PMT NCD DNP, Hawaii 2005
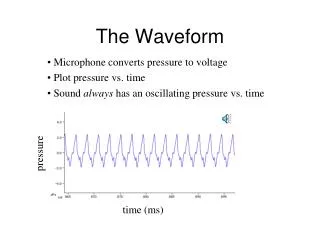
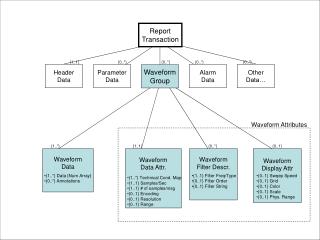
5 cm n 3H p 3He Proportional counters • 36 counters are filled with 3He n + 3He p + 3H+. • Ionization from the p and 3H produces a signal on the central wire. • The shape of the signal depends on the ionization track orientation. wire DNP, Hawaii 2005
Neutron with p-t track to wire DNP, Hawaii 2005
Neutron with p-t track || to wire DNP, Hawaii 2005
Alpha track to wire DNP, Hawaii 2005
Data cleaning • There are also waveforms caused by electronics noise. • Two independent methods have been developed to identify this noise: • One works in the time domain. • The other works in the frequency domain. • The goal is to have both the sacrifice and contamination less than 1%. DNP, Hawaii 2005
Discharges DNP, Hawaii 2005
Oscillatory transients DNP, Hawaii 2005
“Forks” DNP, Hawaii 2005
Time domain cuts • The decay time, pulse width, and pulse amplitude. allow us to identify spikes and forks. Max half width Min half width Decay time time Amplitude Fork size DNP, Hawaii 2005
Frequency domain cuts • The waveform power spectrum easily identifies oscillations and forks. • Fork events typically have a peak 12 MHz. Neutron event Fork event peak DNP, Hawaii 2005
Fork cuts Normal runs Neutron source runs Fork events DNP, Hawaii 2005
Summary • Many different types of noise events have been identified, with cuts implemented for all the major types. • There is currently better than 99% agreement between the two data cleaning paths, with a plan to improve this. DNP, Hawaii 2005