Understanding Evolution through Comparative Yeast Protein Interaction Networks
This comprehensive exploration delves into the evolution of protein interaction networks in yeast, leveraging comparative annotation methods. By analyzing the metabolic pathways and signaling interactions in model organisms such as kangaroos, humans, mice, and rats, we aim to unveil the complexities of gene regulatory networks. Utilizing advanced techniques including mass spectroscopy and network alignment, we highlight the enigmatic dynamics of molecular interactions and their implications on biological systems. Key achievements in network analysis and the significance of motifs in evolutionary biology are discussed.

Understanding Evolution through Comparative Yeast Protein Interaction Networks
E N D
Presentation Transcript
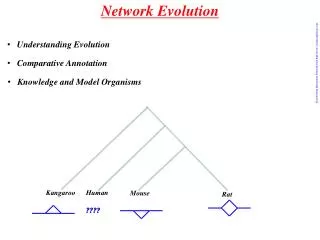
Network Evolution • Understanding Evolution • Comparative Annotation Yeast Protein Interaction Network from http://www.visualcomplexity.com • Knowledge and Model Organisms Kangaroo Human Mouse Rat ????
Gene Regulatory Network Factor A Factor A A B Factor B Factor A mRNA mRNA A B mRNA A B C Factor B mRNA A B C Factor C mRNA mRNA A B C Factor B mRNA A B C Factor C mRNA Remade from Somogyi & Sniegoski,96. F2
Protein Interaction Network Yeast protein interaction network[Jeong et al., Nature (2001)] • The sticking together of different protein is measured by mass spectroscopy. • The nodes will be all known proteins. • Two nodes are connected if they stick together. This can be indicator of being part of a a functional protein complex, but can also occur for other reasons.
Signaling Pathways • Its function is enigmatic as some of the molecules involved are common to different functions and how cross-interaction is avoided is unknown. • Transmits signals from membrane to gene regulation. www.hprd.org from Pierre deMeyts
Metabolic Pathways I2 S I1 P I4 I3 • Flux Analysis • Metabolic Control Theory • Biochemical Systems Theory • Kinetic Modeling
RAFs – Reflexive Autocatalytic Foodsets Kauffman, 1986; Steel, 2001, Hordijk and Steel, 2004; Mossel and Steel, 2005 • a set of molecule types, X; • a set of reactions where each reaction converts one set of molecules (reactants) into another set (products), R; • a set of catalysations: molecules that accelerate a reaction (or set of reactions), C; • a food set: a small set of molecules assumed to be freely available and constantly replenished, F. X={a, b, c, d, e, f, g} R={r1, r2, r3,r4} C={(d,r1), (a,r2), (f,r4)} F={a,b}
RAFs – Reflexive Autocatalytic Foodsets Kauffman, 1986; Steel, 2001, Hordijk and Steel, 2004; Mossel and Steel, 2005 Key achievements: Key problems: • The probability of existence; • Realism; • Algorithms to find them • Predicting catalysis; Natural Extensions: • Let RNA be the molecules, concatenation by base-pairing • Kinetic version: concentrations and rates • Evolving version • RAFs based on real molecules • combinatorially defined • emperically defined – observed molecules (Beilstein) • emperically defined – observed life molecules (Metabolism)
Real Molecule Example of RAF: Citric Acid Cycles Harold J. Morowitz,; Jennifer D. Kostelnik,; Jeremy Yang,; and George D. Cody. From the Cover: The origin of intermediary metabolism PNAS 2000 97:7704-7708 http://en.wikipedia.org/wiki/Citric_acid_cycle
Network Alignment • Network Search Find (approximately) a network within a set of others. • Network integration • Motifs Combine a set of networks to one large network. Network Alignment & Motifs Barabasi & Oltvai, 2004, Sharan & Ideker, 2006 Are nodes/edges labelled? Which operations are allowed? Pair/Multiple?
Metabolic Random Fields Artemisa Labi, Chris Campbell, Istvan Miklos, Move reaction Sequence Analysis: positions 1 n 1 F/S sequences F/S F/S ? S k F/S slow - rs fast - rf Network Analysis: HMM ? ? ? S S
Development of Network/Sequence Analysis 1960 1980 1970 1990 2000 biological sequence comparison Doolittle, Nussinov, Needleman-Wunsch Smith-Waterman First Protein Sequences BLAST Taylor, Lipman, TKF91, … Dayhoff, Jukes-Cantor, Neyman Haussler, Borodovsky, Churchill PAM-BLOSUM SwissPrott, Genbank, EMBL Stormo Multiple Alignment Database searches Automated Pairwise Alignment Fast Dynamic Programming Alignment Analysis of Global Properties High through put level Hidden Markov Models Stochastic Model of Indels Scoring via transition probabilities Mining for motifs and domains Mathematical models of evolution Public Databases Sharan/Karp/Ideker Scale free properties, robustness Ogata-Kanehisa PathBLAST Interaction detection via two hybrid MS Mithani Labi-Campbell MaWish BIND, DIP, MINT, GRID Interologs evolutionary models Alon’s Networks Motifs biological network comparison 1990 2002 2001 2004 2010 2005 2003 Sharan and Ideker, 2006
Network Description and Statistics I Barabasi & Oltvai, 2004 • Degree/Indegree/Outdegree • Shortest Path • Mean Path Length • Diameter: • Clustering Coefficient - CI=2TI/nI(nI-1) • CA=1/10 • Degree Distribution - P(k) • Scale Free Networks P(k)~k-g g>2 • Hubs: multiply connected nodes • The lower g, the more hubs. • Small World Property: • Graph connected and path lengths small Remade from Barabasi, 2004
A. Random Networks [Erdos and Rényi (1959, 1960)] Mean path length ~ ln(k) Phase transition: Connected if: B. Scale Free [Price,1965 & Barabasi,1999] Mean path length ~ lnln(k) Preferential attachment. Add proportionally to connectedness C.Hierarchial Copy smaller graphs and let them keep their connections. Network Description and Statistics II Barabasi & Oltvai, 2004
Stochastic Modeling of Network Evolution 1 2 1 2 1 2 3 4 3 4 3 4 5 5 5 Only topology of networks will be considered. I.e. dynamics and continuous parameters often ignored. Yeast Protein Interaction Network from http://www.visualcomplexity.com What do models of network evolution do?: Test models t1 t2 0 T Estimate Parameters in the Evolutionary Process Ancestral Analysis Framework for Knowledge Transfer
Likelihood of Homologous Pathways Number of Metabolisms: 2 1 + 2 symmetrical versions 3 4 PQ( , )=PQ( )PQ( -> ) Approaches: Continuous Time Markov Chains with computational tricks. MCMC Importance Sampling Eleni Giannoulatou
A Model for the Evolution of Metabolisms • A given set of metabolites: • A core metabolism: Restriction R: A metabolism must define a connected graph M + R defines 1. a set of deletable (dashed) edges D(M): 2. and a set of addable edges A(M): • A given set of possible reactions - • arrows not shown. • A set of present reactions - M • black and red arrows • Let m be the rate of deletion • l the rate of insertion • Then
P(N1-->N2) and Corner Cutting • How many networks could be visited on “almost shortest” paths? 1 2 1 2 3 4 3 4 5 5 How can P( ) be evaluated? Can be found in P() at appropriate rows. In general not very useful (number of metabolisms). Simulations Forward with symmetries could be used in specific cases. Backward (coupling from the past) If d(N1,N2) = k, then there are 2k networks are visitable on shortest paths. If 2 additional steps are allowed, then 2k (L +L(L-1)/2 +(L(L-1)..(L-+1)/!) are visitable. Example. 15 nodes, L=105, t=t=0.05, =2, d=4. P(4)= e-.5.54/4!~.003 P(6)= e-.5.56/6!<10-4 Olle Haegstroem (2002) Finite Markov Chains and Algorithmic Applications, Cambridge University Press Lyngsø R, Y.S.Song and J.J.Hein (2008) “Accurate Computation of Likelihoods in the Coalescent with Recombination via Parsimony “ In press Recomb
A Toy Example(by Aziz Mithani) Equilibrium Probability • Metabolic Universe • 12 possible edges • 1i 1u 3 • 1i 2u 3 • 2u 1i 3 • 2i 2u 3 Transition Probability dist=6 Transition Probability: Full Exponentiation (212 states 4096) Exponentiation with corner cutting 26 - 64, 384, 960, 1280 ,960, 384, 64 MCMC Integration Adding Connectedness The proportion present: Favouring insertions connecting