Forecasting and Trading Commodity Contract Spreads with Gaussian Processes
260 likes | 444 Vues
Forecasting and Trading Commodity Contract Spreads with Gaussian Processes. Nicolas Chapados and Yoshua Bengio University of Montreal and ApSTAT Technologies Inc. Approach in a Nutshell. Commodity spreads exhibit regularities

Forecasting and Trading Commodity Contract Spreads with Gaussian Processes
E N D
Presentation Transcript
Forecasting and Trading Commodity Contract Spreads with Gaussian Processes Nicolas Chapados and Yoshua Bengio University of Montreal and ApSTAT Technologies Inc.
Approach in a Nutshell • Commodity spreads exhibit regularities • Use a flexible regression approach to forecast the complete future price trajectory of a spread • Gaussian Processes • Augmented functional representation of trajectory • From the forecast trajectory, identify profitable opportunities (accounting for risk) • Experiments with a portfolio of 30 spreads • Profitable out-of-sample after transaction costs
Preliminary Remarks • Statistical learning algorithms will not make you rich • Overfitting is a central problem in finance • Only one historical trajectory • Extremely low signal-to-noise ratio • The economy is non-stationary • Bias-variance dilemma takes an interesting form • If you use a long history, you reduce variance but introduce bias • Conversely, with a short history you have little bias but high variance • As a result, model selection is difficult • Bayesian approches promise (theoretically) an automatic control of overfitting
Portfolio Choice:Conceptual Landscape • One-Period Models • Classical « mean-variance » framework (Markowitz) • Fixed investment horizon (one month, one quarter) • Predict the moments of the next-period asset return distribution (e.g. mean and covariance matrix) • Quadratic programming to find optimal portfolio weights that maximize a utility function: best return subject to risk constraint • Direct models using learning algorithms • Train a (e.g.) neural network to directly make a portfolio allocation decision from input variables • Can use a regression or classification framework • Training criterion: can maximize a financial utility that incorporates risk aversion and the effect of trading costs
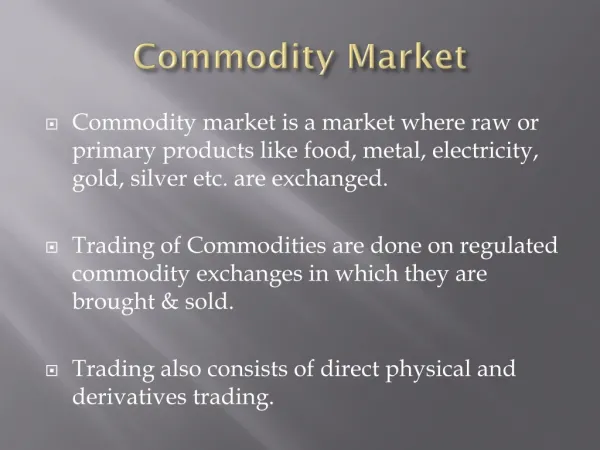
Commodity Spreads • Price difference between two futures contracts • Example, as of July 24th, 2008: • Closing price for « Wheat, September 2008 »: $787.75 • Closing price for « Wheat, December 2008 »: $811.25 • Difference (Spread) : 787.75 – 811.25 = –23.50 • Objective: forecast these spreads 100 Jul-Dec CME Lean Hogs15-year average (1991-2005) 80 60 40 20 0 Sep Oct Nov Dec Jan Feb Mar Apr May Jun Jul Aug
Empirical Regularities in Commodity Spreads • Soybeans Crush Spread (Simon, 1999) • Long-run cointegration among the constituents • Short-term mean reversal (5-day horizon) • Simple rules yield in-sample profits after transaction costs • Petroleum Crack Spread (Girma & Paulson, 1998) • Seasonality at both monthly and trading-week levels • Out-of-sample profits after transaction costs • Gold-Silver Spread (Liu & Chou, 2003) • Dunis et al. (2006 a,b) study both the crack and the crush spreads
Modeling Objectives • Nonparametrically exploit seasonalities that occur in commodity spreads • Concentrate on the simplest kind:intracommodity calendar spreads • Fixed maturities: e.g. March–July Wheat • Does not require the definition of a roll schedule • Problem is characterized by a large number of separate historical time series (one per trading year in the historical data)
What do Gaussian Processes Buy Us? • Rather than forecasting the distribution of the next-period returns, we can model the complete future price trajectory • A classical approach represents P(rt+1|It) • It is the information set available at time t • Example, an AR(1) model: yt+1 = a + byt + e,with e ~ N(0, s2) • A Gaussian Process can represent the joint distribution of all future prices, in particular P(pt+D|It, D), for D>0.
Gaussian Processes • General tools for nonlinear regression • Fully Bayesian Treatment • Start with a prior probability distribution on the space of functions • Observe some data • Infer a posterior distribution, given the observed data (from Bayes’ rule)
Gaussian Processes — Details • Generalization of the normal distribution • Multivariate normal: elements of a vector are related by a covariance matrix • Gaussian process: values of the function at two points are linked by a covariance function • Analytical solution • Not subject to the optimization difficulties of neural networks — simple matrix algebra • Can produce a full covariance matrix between a set of new test points
Gaussian Processes — Details 2 • Let k(x,y) be a semidefinitive positive covariance function (kernel) • X — M x d matrix of training inputsy — M-vector of training targetsX* — M’ x d matrix of test inputs • Predictive distribution of test outputs at test inputs is normal with mean and covariance matrix given by • with
Historical Data: March–July Wheat Normalized Price Days to Maturity Year
Inputs and Target Representation • Time is an independent variable. Split into: • Current series index (e.g. trading year) • Operation time: time at which the forecast is made • Forecast horizon: # of days ahead we are forecasting • Other inputs must be known at operation time • Target is (normalized) spread price • We are learning a model of
Forecasting Performance • AugRQ/all-inp: Reference model • Inputs: augmented time representation • Spread price + term-structure shape • Economic inputs (USDA ending stocks + stock-to-use ratio) • AugRQ/less-inp. Remove USDA inputs • AugRQ/no-inp. Remove price inputs • StdRQ/no-inp. • Linear/all-inp. Bayesian linear regression • AR(1)
Evaluation Methodology • Perform comparison using a modified Diebold-Mariano (1995) test that accounts for cross-correlations between test sets.
From Forecasts to Trading Decisions • Use a forecast of the complete future trajectory (made at time t0) to find best trading opportunity • Information Ratio-like Criterion • Each component is obtainable from the Gaussian process forecast, e.g. • Entry condition: find t1, t2 > t0 which maximize the IR criterion • Exit condition: find exit time t2 which maximizes the IR criterion, given the current position
Behavior on a Single Trading YearWheat March–July / 1996 • Re-train model every 25 days • Sequence of decisions: short – neutral – long • Lower panel: Cumulative P&L ($)
Portfolio of 30 Spreads • Common Input Variables • Current spread price • Prices of first 3 near contracts • Normalization • Grains and related (SBM, SB, W) • USDA Ending Stocks (YoY difference) • USDA Stocks-to-Use Ratio • Transaction costs • 5 basis points per trade • (Each leg=separate trade)
Conclusions and Future Research • Functional representation of time series • Make (relatively) long-term forecasts • Progressively-revealed information sets • Handle irregularly-sampled data • Trading decisions based on IR-like criterion • Good out-of-sample performance on a portfolio of 30 commodity spreads • Limits of Gaussian processes: computation time grows as O(N3) with the data size • Approximation methods to handle larger data sets