MathCAD: Data Analysis and Approximation Techniques
Learn to input, read, and analyze data in MathCAD using tables, files, and Excel sheets. Explore interpolation, uniform and square-mean approximation methods with MathCAD tools for efficient data approximations.

MathCAD: Data Analysis and Approximation Techniques
E N D
Presentation Transcript
MathCAD Data
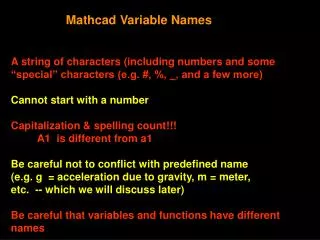
Data in tables • Tables are analogous to matrix • The numbers of columns and rows can be dynamically changed (in contrast to matrix) • To enter table: • Menu: Insert/Component/Input Table • In placeholder type variable name which will be assigned to table • In cells type the values • Each rows must contains the same number of data. If data are missing the value ‘0’ will be assigned • Access to data in table are matrix like.
Data in files • The most popular file formats accepted by MathCAD: • Text files • Excel worksheets • MATLAB • To insert text file containing data: • Menu: Insert/Component/File Read or Write • Chose file format • Browse to the file location • In the appeared placeholder type variable name that will be assigned to the contents of file
Inserting the text file • Changes in the text file location
Inserting the Excel sheets • A range of Excel cells can be inserted into the MathCAD • There can be more then one range in single insertion • One variable is being assigned to one range • All variables forms a vector • Cells can contain numbers as well as text (in contrast to table and text files) • Worksheets can be edited (double-click) using all Excel functions (object embedded). Excel has to be installed in system.
Inserting the Excel sheets • To insert worksheet: • Menu: Insert/Component/Excel • Browse file or create new • Choose number of ranges for input and output (relatively to Excel worksheet). If no data have to be inserted into the Excel worksheet type inputs number 0 • Type ranges corresponding to outputs – e.g. A1:B10 (if sheet name is different from Sheet1 type sheet name – e.g. Sheet4!A1:B10) • In placeholder(s) type variable(s) • Number of outputs/inputs and range of cells can be edited in prosperities of insertion
MathCAD files as data source in MathCAD • MathCAD can use data included in other MathCAD files • Access to data is possible after embedding MathCAD file: • menu: Insert/References, • Brows file on disc or type file address • Below the insertion all data, definitions, assignment from inserted file are valid in the present document • Problem: indexed variables.
Data analysis and optimisation Approximation
definition • Approximation is a part of numerical analysis. It is concerned with how functions f(x) can be best approximated (fitted) with another functions F(x)
aplication • Simplifying calculations when original function f(x) is defined by complicated expression • Creation of continuous dependency when function f(x) is ascribed on discrete set of arguments. For known form of approximating function only values of function parameters giving the best approximation are to determine.
types of approximation • Interpolating approximation • Uniform approximation • Square-mean approximation
Interpolating approximation • Needs to satisfy condition: function given f(x) and approximating function F(x) have the same values on the set of nodes and (sometimes) the same values of derivatives (if they are given) too.
Uniform approximation • Function F(x) approximating function f(x) in the range [a,b], that maximal residuum reaches minimum
Square-mean approximation • Approximating function is determined by the use of condition : Geometrically condition means: The area between curves representing functions have to reach minimum.
Square-mean approximation • Condition for discreet set of arguments:
Square-mean approximation in MathCAD • Function: minimize(function, p1, p2,...) can be used to determine parameters of approximating function minimizing the sum of mean square deviations between values given in the table and calculated from the function. • function calculates the sum of mean square deviations as a function of parameters. • p1, p2 – parameters of approximating function
Square-mean approximation in MathCAD • Approximating algorithm: • Insert data to be approximate • Build the approximating function • Create a counting variable with values from 0 to number of data minus 1 • Build function that calculates sum of square of deviations with parameters of approximating function as variables • Assign starting values of parameters • Use the function minimize.
Advantageous of minimize function: • simple • explicit • suitable for any approximating function • can be used in optimisation problem solving
genfit • Syntax:c:=genfit(X, Y, c0, F) • X – vector of independent values from data set • Y - vector of dependent values from data set • c0 – starting vector of searched parameters • F – vector function of independent variable and vector c, consists of approximating function and its derivatives on parameters • c - vector of searched parameters
regress • Approximation by polynomial function • Syntax: Z:= Regress(X, Y, s) • X – vector of independent values from data set • Y - vector of dependent values from data set • s – polynomial degree • Z – result: vector, s+1 last elements are parameters of polynomial
Linear, cubic Spline • Approximation by linear (cubic etc.) spline function • Syntax: Z:=lspline(X, Y)(cspline) • X – vector of independent values from data set • Y - vector of dependent values from data set • Data in set has to be sorted! Manually or by use function csort: W:=csort(W,i), W – matrix of data, i – nr of ordering column • Z – result: vector of parameters of cubic spline function
Can be integrate Can be derivate
Interpreting function • Operates on vectors obtained from regress and l(c)spline functions • Building the continuous approximating function on the base of determined parameters • Syntax: F(x):=interp(Z, X, Y, x) • Z – vector given by approximating function • X – vector of independent values from data set • Y - vector of dependent values from data set • x – independent values • Interpreting function is implicit but can be derivated and integrated