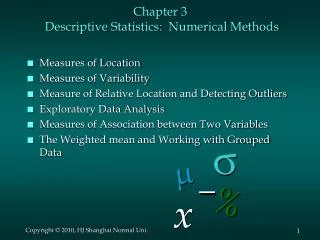
Chapter 3 Descriptive Measures
Section 2 Measures of Variations. Chapter 3 Descriptive Measures. Measures of Variation. There are three common measures for the spread or variability of a data set they are range , variance , and standard deviation .

Chapter 3 Descriptive Measures
E N D
Presentation Transcript
Section 2 Measures of Variations Chapter 3Descriptive Measures
Measures of Variation There are three common measures for the spread or variability of a data set they are range, variance, and standard deviation. To describe the difference quantitatively, we use a descriptive measure that indicates the amount of variation, or spread, in the data set. These are referred to as measures of variation or measures of spread. The range rule of thumb: A rough estimate of the standard deviation is
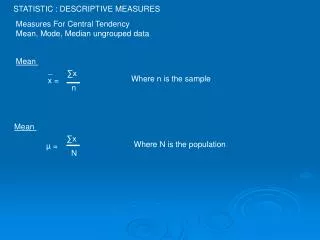
Variance: • is the average of the squares of the distance each value is from the mean. • The symbol for the population variance is σ2. Greek lower case letter sigma. • Symbol for sample variance is s2. X = individual values μ = population mean N = population size = sample mean n = sample size Sample Variance = Population Variance =
Figure 3.3 The “data sets” have the same Mean, Median, and Mode yet clearly differ! Measures of Variation or Measures of Spread
Range of a Data Set Range of a Data Set The range of a data set is given by the formula Range = Max – Min, where Max and Min denote the maximum and minimum observations, respectively. Range: • distance between the highest value and the lowest value. • The symbol R is used for the range. • R = highest value – lowest value
Figure 3.4 Measures of Variation or Measures of Spread: The Range Team I has range 6 inches, Team II has range 17 inches.
Standard Deviation: • Measures variation by indicating how far, on average, the observations are from the mean. • is the square root of the variance. • Symbol for the population standard deviation is σ (sigma). Symbol for the sample standard deviation is s. • Variation and the Standard Deviation: The more variation that there is in a data set the larger is its standard deviation • Rounding rule: The final answer should be rounded to one more decimal place than the original data. Sample Standard Deviation = Population Standard Deviation =
Sample Standard Deviation Deviations from the Mean is how far each observation is from the mean and is the first step in computing a sample standard deviation. Sum of Squared Deviation is the sum of the squared deviations from the mean ∑(x1 - )2 and gives a measure of the total deviations from the mean for all the observation.
Sample Standard Deviation – standard deviation of a sample. Take the square root of the sample variance. Sample variance formula = Why is the denominator (n – 1) rather than n? Division by (n – 1) increases the value of the sample variance so that it will more closely reflect the population variance. Giving us an unbiased estimate for the population variance. Shortcut or computational formulas for data obtained from samples: Variance Standard Deviation
Variances and standard deviations can be used to determine the spread of the data. If the variance or standard deviation is large, the data are more dispersed. The information is useful in comparing two (or more) data sets to determine which is more (most) variable. The measures of variance and standard deviation are used to determine the consistency of a variable. The variance and standard deviation are used to determine the number of data values that fall within a specified interval in a distribution. The variance and standard deviation are used quite often in inferential statistics. Variance and Standard Deviation
Computing Formula for a Sample Standard Deviation Rounding rule: do not perform any rounding until the computation is complete, otherwise, substantial round off error can result.
Table 3.10 Standard Deviation: the more variation, the larger the standard deviation. Data set II has greater variation. Table 3.11
Figure 3.6 Data set II has greater variation and the visual clearly shows that it is more spread out. Data Set I Figure 3.7 Data Set II
Three-Standard-Deviation Rule Almost all the observations in any data set lie within three standard deviations to either side of the mean.
Example: Find the variance and standard deviation. Exam Scores: For 108 randomly selected college students, the exam score frequency distribution was obtained. (90+98)/2 94 6 * 94 564 6*(94)2 53,016
Example: Variance = Standard Deviation = *** NOTE: 9.072 = 82.26 ***