Download
1 / 14
140 likes | 234 Vues
Explore how to integrate interactive Google maps into your web page for various Australian Statistical Districts like Greater Hobart, Brisbane, Sydney, and more. Learn about the pros and cons of using Google maps and set up a feedback form for visitors.

E N D
Tasmania Statistical Subdivision • Greater Hobart (this is the same as Greater Hobart SD) • Australia Capital Territory Statistical District • Canberra • Australian Capital Territory Statistical Subdivision • North Canberra • Belconnen • Woden Valley & Tuggeranong & South Canberra • Queensland Statistical District • Brisbane • Darling Downs • Far North Queensland • Fitzroy • Mackay • Moreton • North Queensland • Western Queensland • Wide-Bay Burnett • Queensland Statistical Subdivision • Beaudesert & Ipswich • Brisbane City • Caboolture & Redcliffe • Gold Coast • Logan City • Pine Rivers Shire • Redland Shire • New South Wales Statistical Subdivision • St George Sutherland • Canterbury-Bankstown • Fairfield-Liverpool • Outer South Western Sydney • Inner Western Sydney • Eastern Suburbs • Lower Northern Sydney • Northern Beaches • Central Northern Sydney • Inner Sydney • Blacktown • Outer Western Sydney • Central Western Sydney • Gosford-Wyong • Western Australia Statistical District • Perth • Western Australia Statistical Subdivision • Central Metropolitan • East Metropolitan • North Metropolitan • South East Metropolitan • South West Metropolitan • Tasmania Statistical District • Greater Hobart • Northern • Southern & Mersey-LyellGreater Hobart SD) • South Australia Statistical District • Eyre • Murray Lands • Outer Adelaide • Northern • South East • Yorke and Lower • South Australia Statistical Subdivision • Northern Adelaide • Southern Adelaide • Western Adelaide • Eastern Adelaide • Northern Territory Statistical District • Darwin • Northern Territory – Balanced • Northern Territory Statistical Subdivision • Darwin City • Litchfield Shire & Palmerston-East Arm • New South Wales Statistical District • Sydney • Hunter • Illawarra • Richmond-Tweed • Mid-North Coast • Northern • North Western • Central West • South Eastern • Murrumbidgee • Murray and Far West ChallengingRacism Project
How do you go from this Interactive maps • South Australia Statistical District • Eyre • Murray Lands • Outer Adelaide • Northern • South East • Yorke and Lower • South Australia Statistical Subdivision • Northern Adelaide • Southern Adelaide • Western Adelaide • Eastern Adelaide • New South Wales Statistical District • Sydney • Hunter • Illawarra • Richmond-Tweed • Mid-North Coast • Northern • North Western • Central West • South Eastern • Murrumbidgee • Murray and Far West • Northern Territory Statistical District • Darwin • Northern Territory – Balanced • Northern Territory Statistical Subdivision • Darwin City • Litchfield Shire & Palmerston-East Arm • Tasmania Statistical Subdivision • Greater Hobart (this is the same as Greater Hobart SD) • Australia Capital Territory Statistical District • Canberra • Australian Capital Territory Statistical Subdivision • North Canberra • Belconnen • Woden Valley & Tuggeranong & South Canberra • Queensland Statistical District • Brisbane • Darling Downs • Far North Queensland • Fitzroy • Mackay • Moreton • North Queensland • Western Queensland • Wide-Bay Burnett • Queensland Statistical Subdivision • Beaudesert & Ipswich • Brisbane City • Caboolture & Redcliffe • Gold Coast • Logan City • Pine Rivers Shire • Redland Shire • New South Wales Statistical Subdivision • St George Sutherland • Canterbury-Bankstown • Fairfield-Liverpool • Outer South Western Sydney • Inner Western Sydney • Eastern Suburbs • Lower Northern Sydney • Northern Beaches • Central Northern Sydney • Inner Sydney • Blacktown • Outer Western Sydney • Central Western Sydney • Gosford-Wyong • Western Australia Statistical District • Perth • Western Australia Statistical Subdivision • Central Metropolitan • East Metropolitan • North Metropolitan • South East Metropolitan • South West Metropolitan • Tasmania Statistical District • Greater Hobart • Northern • Southern & Mersey-LyellGreater Hobart SD)
Interactive maps to this?
Google maps There’smore to Google maps than just getting from A to B
Google maps Now you have aninteractive Google map! How do you get your Googlemap into your web page?
Google maps Pros • Fun • Easy • Free Cons • Can’t link to asset numbers • Google removes some code • Delete means delete!
Feedback form The research team wanted to know more about visitors to the site e.g. • What type of organisation are you from? • Are you from overseas or which Australian State/Territory • Do you think the data regarding your region is true?
Feedback form Responses are collected in a database. The Web Services Unit (WSU) can provide reports on request. Visit the Web Services Unit http://www.uws.edu.au/webservices/wsuto request a form.
Rotating banner Images provided by iMedia complete with UWS branding and research project name.
Rotating banner For an example of a Rotating Banner, please see http://www.uws.edu.au/ssap/school_of_social_sciences_and_psychology/research/challenging_racism
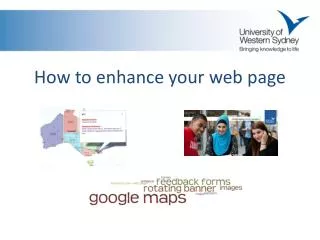
Threeideas for enhancing your web page: • Googlemaps • Forms • Rotatingbanners